Beelink’s GTi11 is the latest offering in their ‘GT’ series of slightly larger mini PCs that are notable for expandable storage configurations together with multiple ports and characterized by including a fingerprint scanner. Featuring Intel’s 11th generation Tiger Lake processors, Beelink kindly sent an i5 version for review which I will undertake in three parts. In this first part, I’ve looked at Windows performance and the second part will cover Ubuntu with the third part looking at various configuration mods.
Beelink GTi11 Hardware Overview
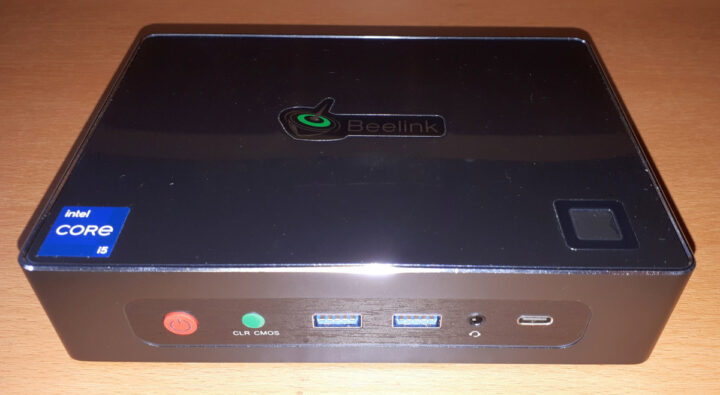
The GTi11 physically consists of a 168 x 120 x 39mm (6.61 x 4.72 x 1.54 inches) rectangular metal case. As an actively cooled mini PC, it uses Intel’s ‘10 nm SuperFin’ Tiger Lake processors and the review model included an i5-1135G7 which is a quad-core 8-thread 2.50 GHz Core processor boosting to 4.20 GHz with Intel’s Xe Graphics.
The front panel has an illuminated power button, a ‘CLR CMOS’ button, dual USB 3.1 ports, a 3.5mm headphone jack, and a Thunderbolt 4 port. The rear panel includes the power jack, dual 2.5 Gb Ethernet ports, an HDMI (assumed to be 2.0) port, a DisplayPort, dual USB 3.0 ports, and dual USB 2.0 ports. On the top of the device is a fingerprint sensor.
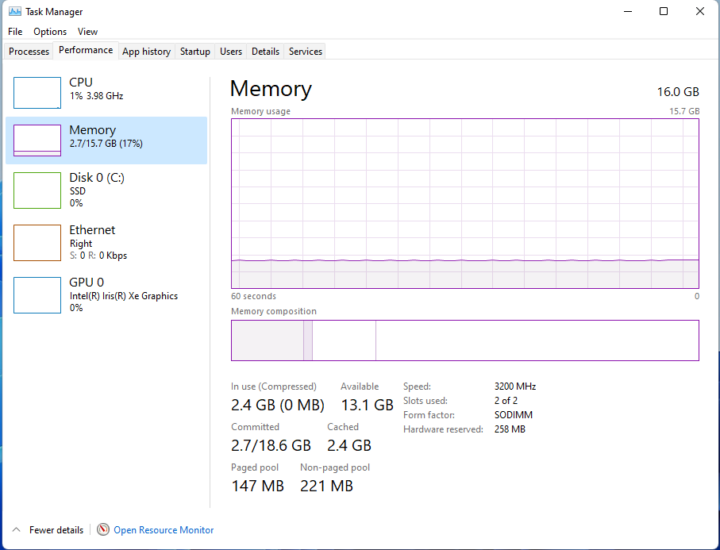
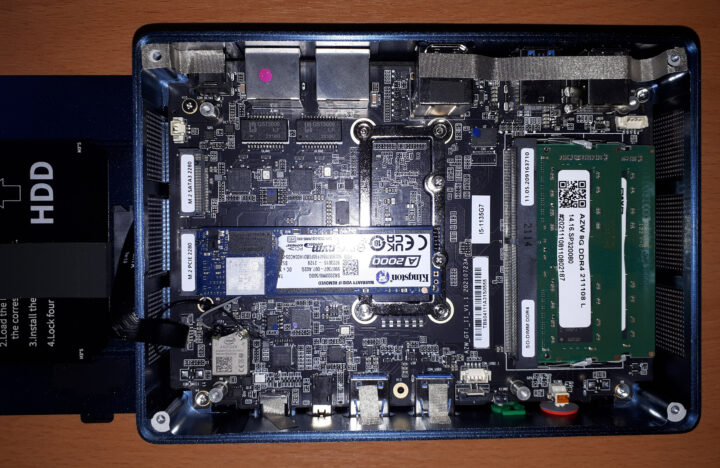
The review model also included a 500GB M.2 2280 NVMe PCIe Gen 3.0 SSD drive complete with Windows 10 Pro installed and two sticks of 8GB DDR4 3200 MHz memory:
Additionally, there is a soldered WiFi 6 (or 802.11ax) Intel AX201 chip and the ability to add an additional M.2 2280 SATA SSD drive as well as a 2.5” SATA drive to the lid which is connected to the motherboard via a short ZIF cable:
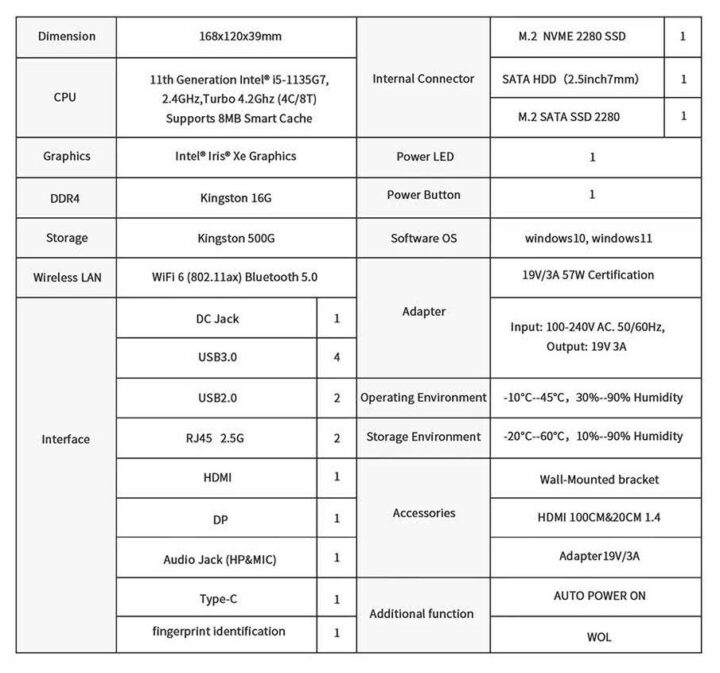
The specifications state:
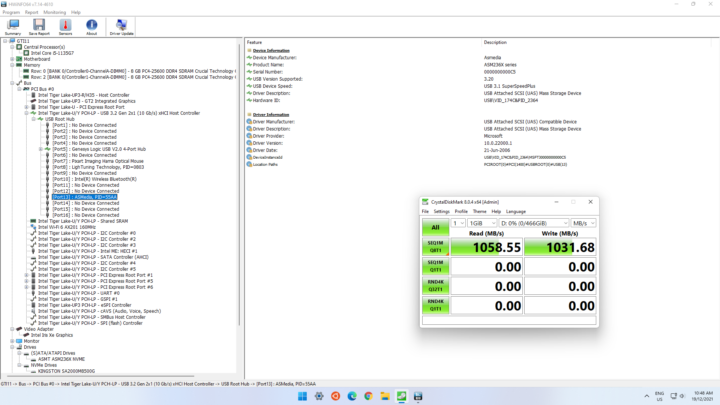
and lists four of the USB ports as 3.0 so I tested them using a Samsung 980 PRO PCle 4.0 NVMe M.2 SSD housed in an ‘USB to M.2 NVMe adapter’ (ORICO M2PAC3-G20 M.2 NVMe SSD Enclosure). Interestingly the testing revealed that the front two USB ports were actually 3.1 (USB 3.2 Gen 2×1 i.e. 10 Gbit/s):
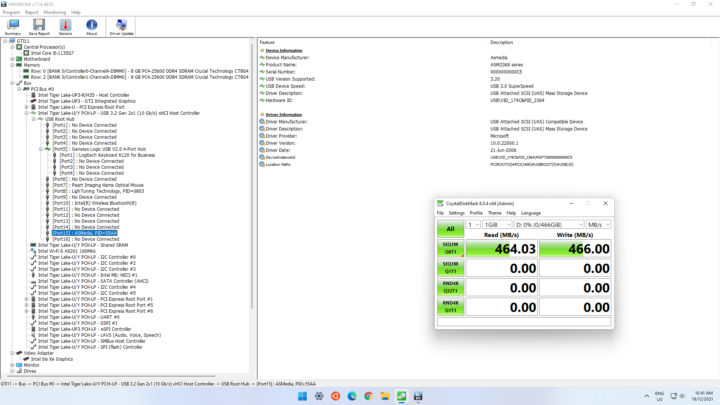
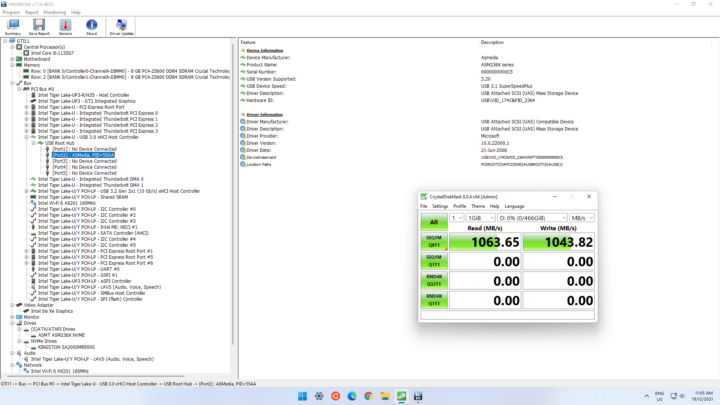
and only the rear ports were 3.0 (USB 3.2 Gen 1×1 i.e. 5 Gbit/s):
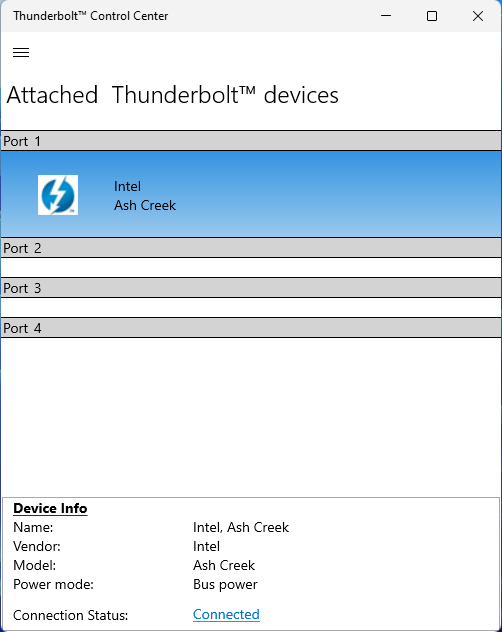
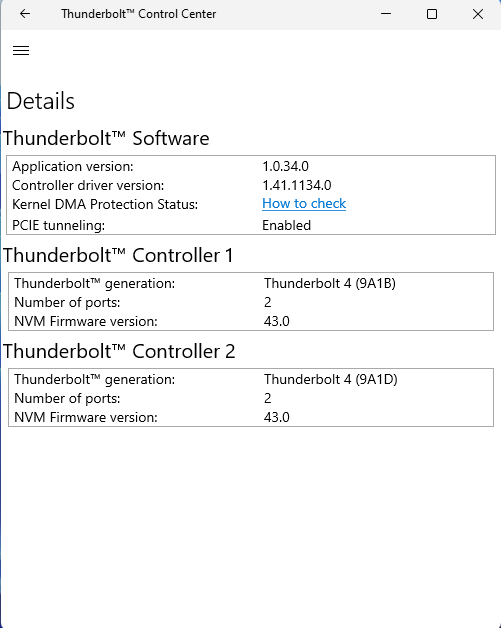
Another point of interest is that the front ‘Type-C’ port is actually a Thunderbolt 4 port:
which I confirmed using the same Gen 4.0 NVMe SSD but housed in my JEYI Thunderbolt 3 M.2 NVMe Enclosure:
When ‘used’ as a USB ‘Type-C’ port it also runs at USB 3.1 speed:
or it can support video output through ‘Alternate Mode’:
which together with the HDMI port and DisplayPort, in theory, enables support for triple displays. Unfortunately, I couldn’t get any signal from the DisplayPort despite trying multiple monitors and cables leading me to suspect that the port is faulty on this particular sample.
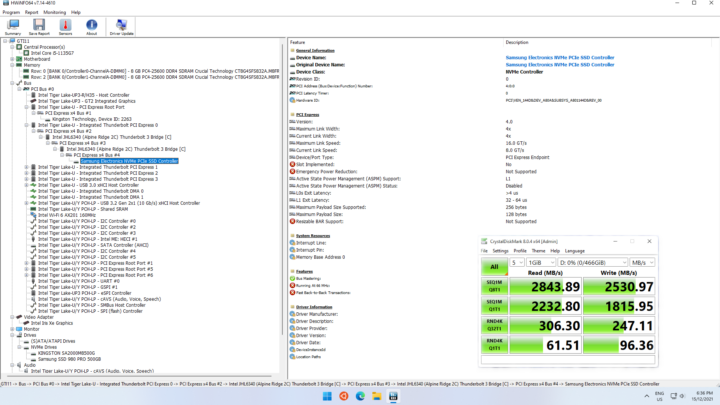
The other points of interest are that the M.2 NVMe slot is actually Gen 4.0, not Gen 3.0:
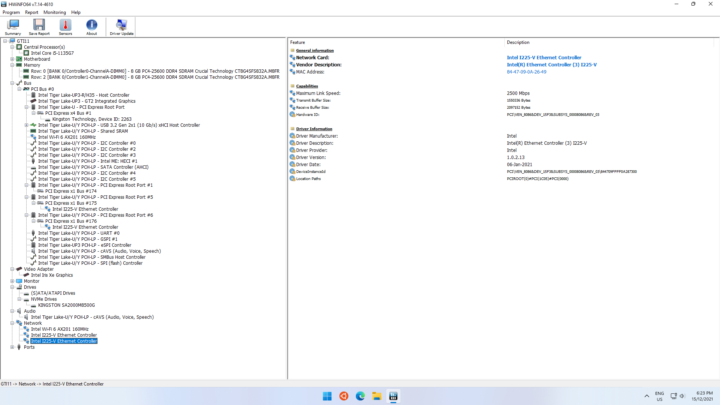
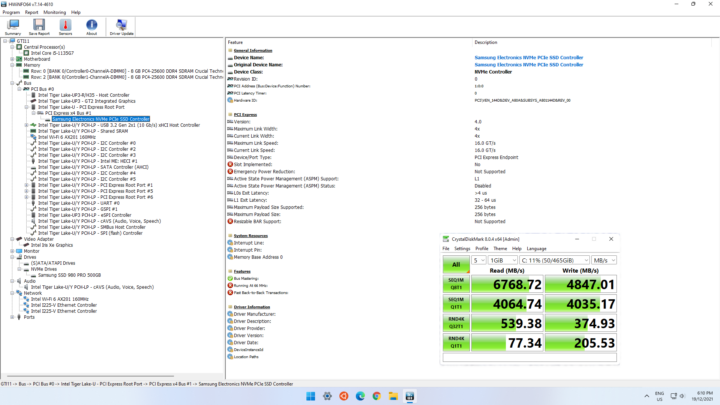 and that both Ethernet ports are 2.5Gb:
Box contents
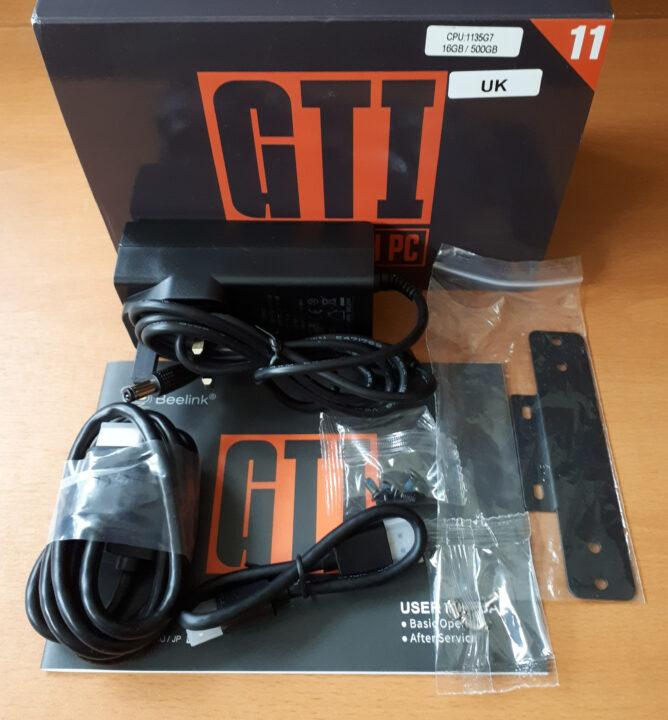
In the box you get a power adapter with a cord, both a short and a longer HDMI cable, a VESA mounting bracket together with a couple of small packets of miscellaneous screws. Also included is a multilingual user manual:
Review Methodology
When reviewing mini PCs I typically compare their performance against some of the more recently released mini PCs. I now review using Windows 11 version 21H2 and test with a selection of commonly used Windows benchmarks. I also use ‘Phoronix Test Suite’ so that I can benchmark with the same set of tests on Ubuntu for comparison purposes.
Prior to benchmarking, I perform all necessary installations and updates to run the latest versions of both OSes. I also capture some basic details of the device for each OS.
Beelink GTi11 Windows Performance
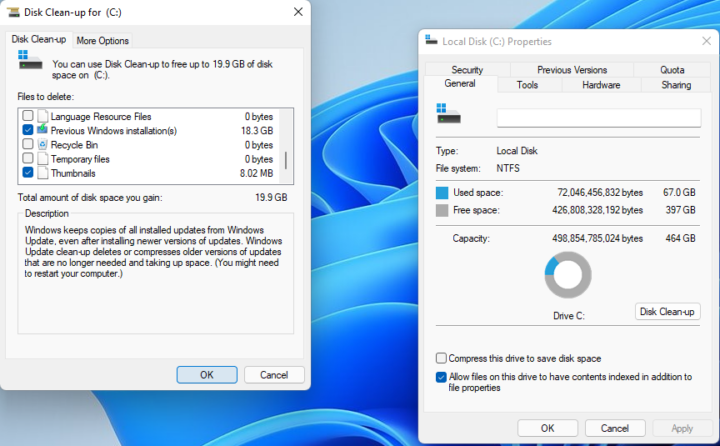
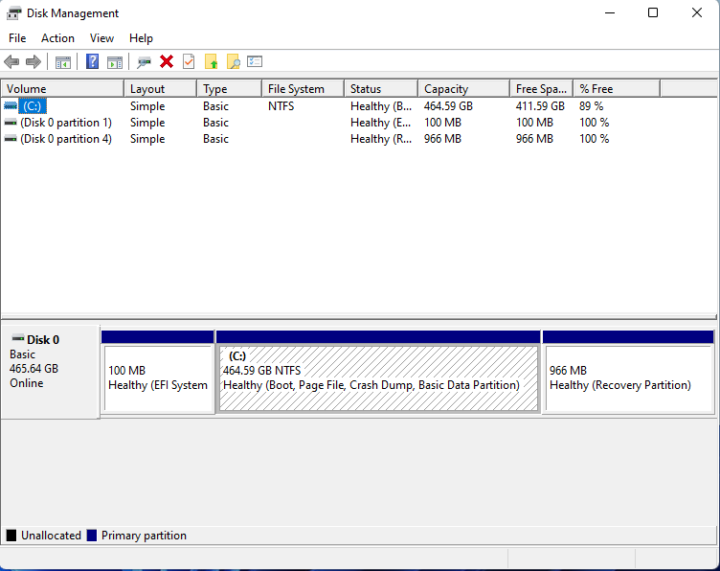
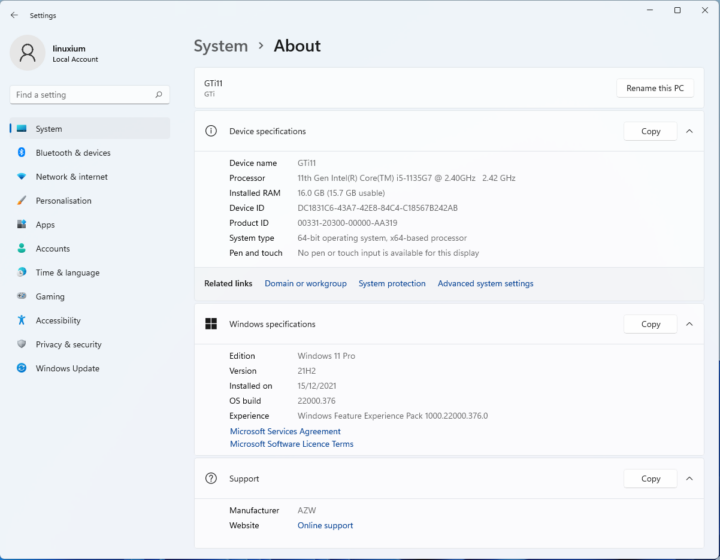
Initially, the GTi11 came installed with a licensed copy of Windows 10 Pro version 21H1 build 19043.1083 which I upgraded to build 19043.1415 after applying Windows updates. I then successfully upgraded to Windows 11 version 21H2 build 22000.376 and also removed the old Windows 10 installation to save space:
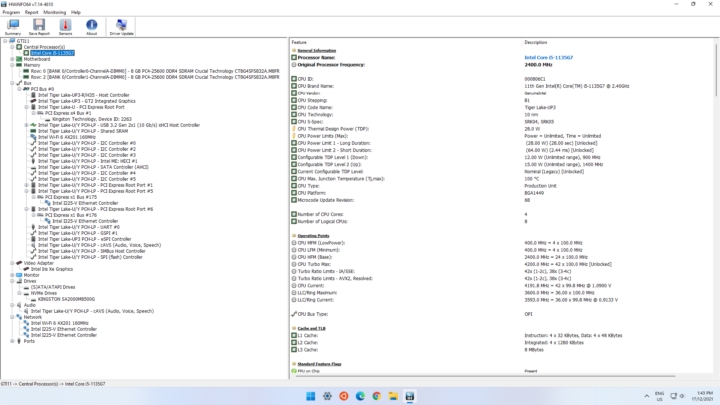
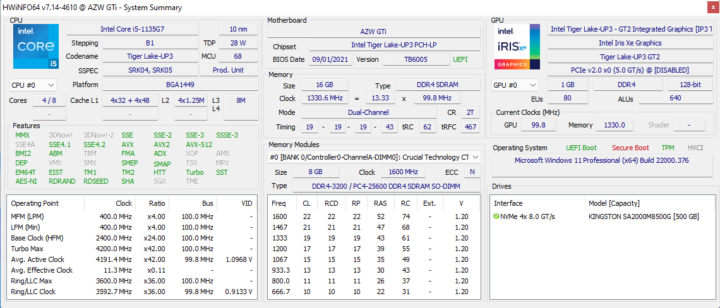
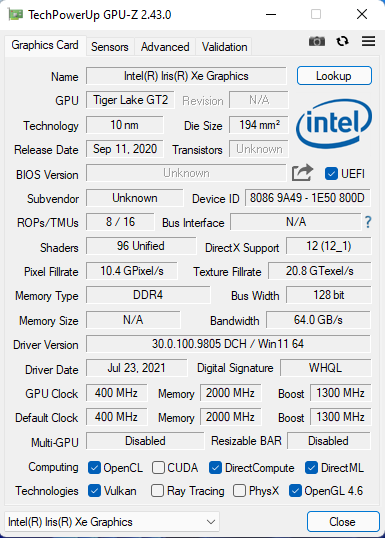
A quick look at the hardware information showed it is aligned to the specification:
A brief check showed working audio, Wi-Fi, Bluetooth, and Ethernet.
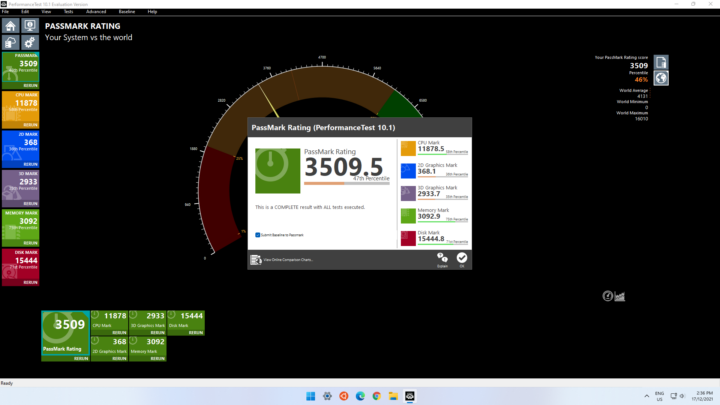
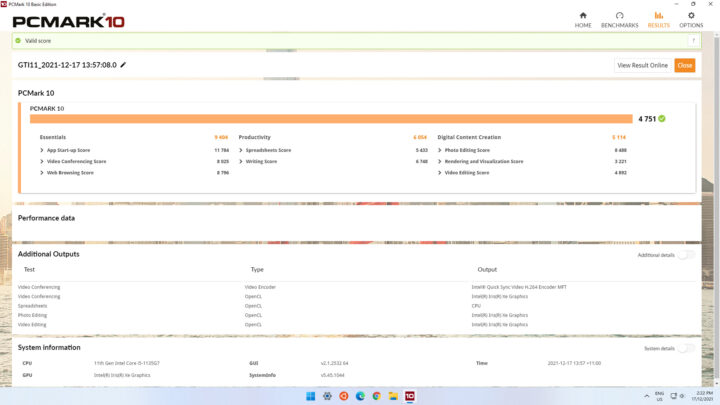
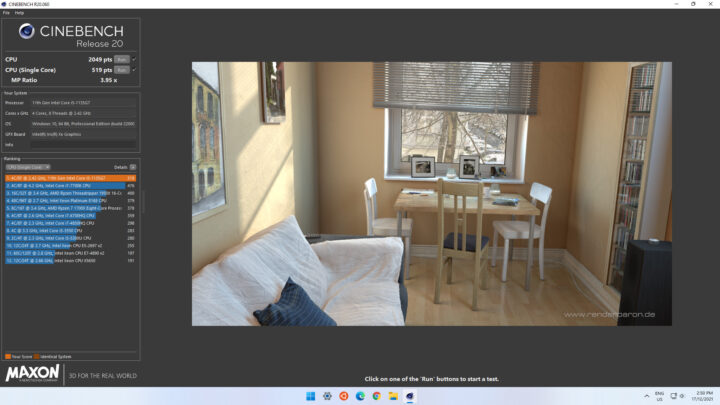
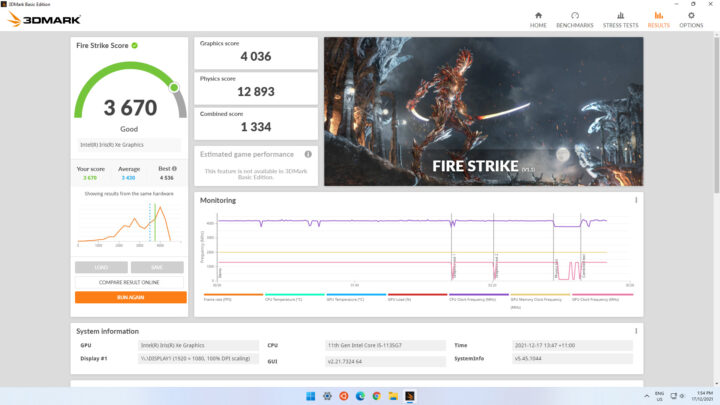
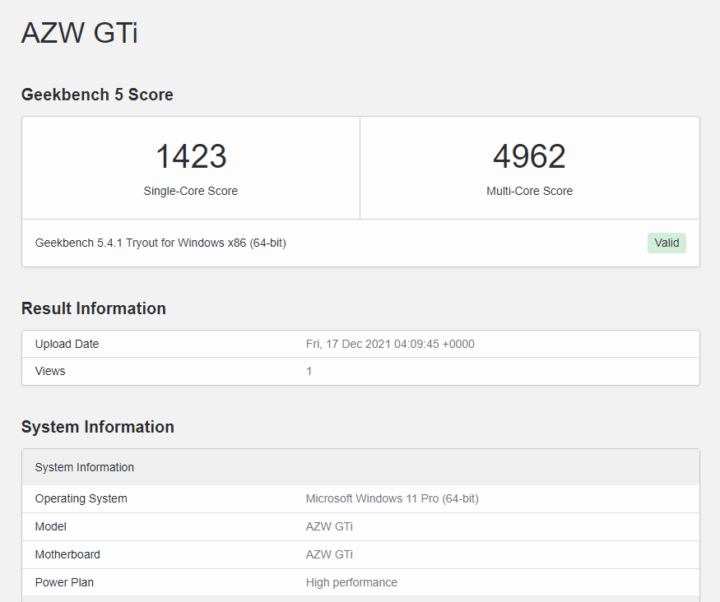
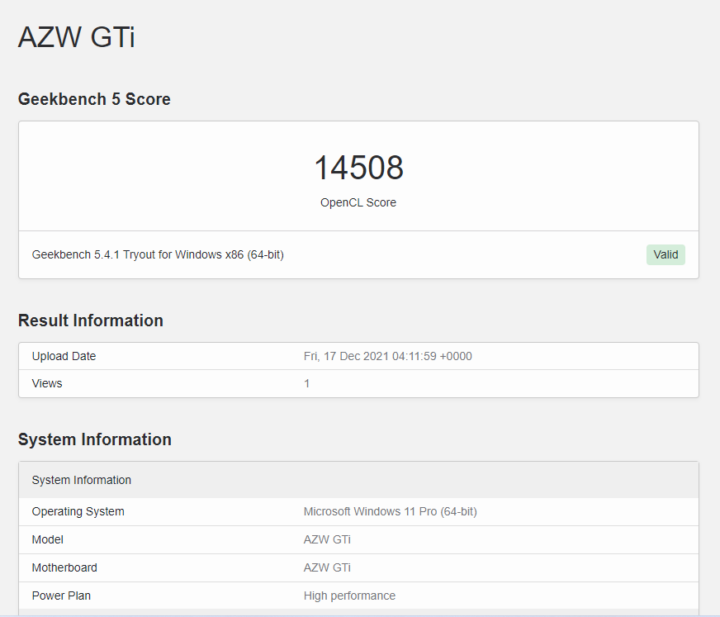
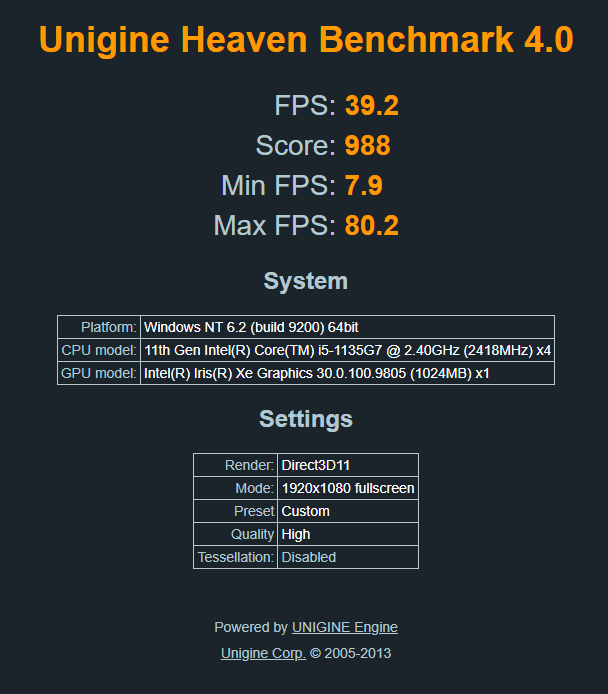
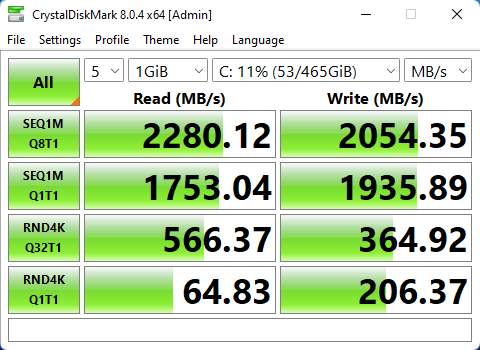
I then set the power mode to ‘High performance’ and ran my standard set of benchmarking tools to look at performance under Windows:
I also tested Cinebench R23 which is becoming the de facto benchmarking version:
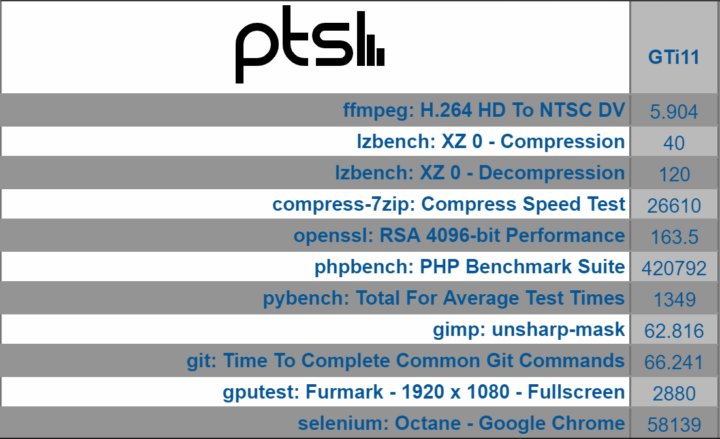
For my specific set of Phoronix Test Suite tests the results were:
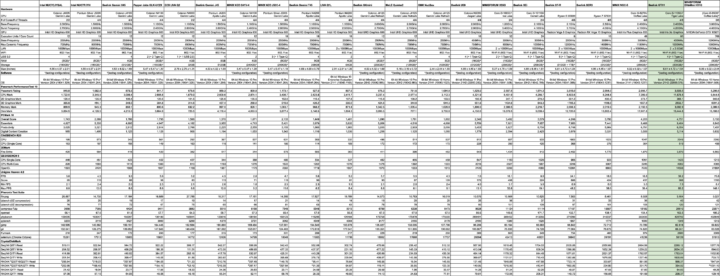
All these results can then be compared with other recent mini PCs:
The results show a noticeable improvement in the integrated GPU performance and the capability of which will be explored further below.
Video playback in browsers & Kodi
Video playback was very impressive with little issues in playing 4K videos in Edge and Chrome:
I also attempted playing an 8K 60 FPS video in YouTube in both Edge and Chrome with only Chrome dropping the occasional frame:
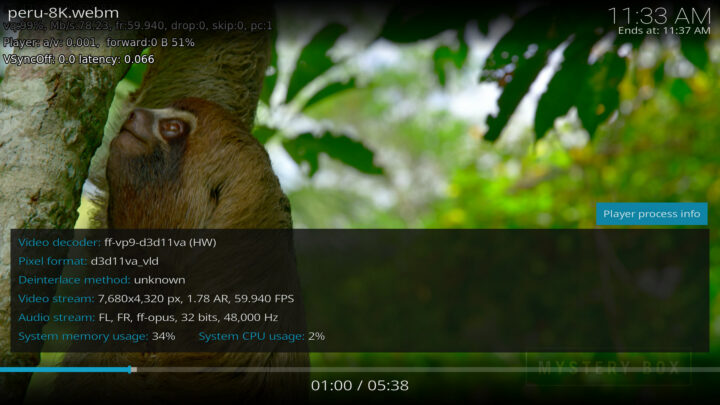
Finally, I played some videos in Kodi of various formats up to 8K 60 FPS all of which played without issue:
Gaming on Beelink GTi11
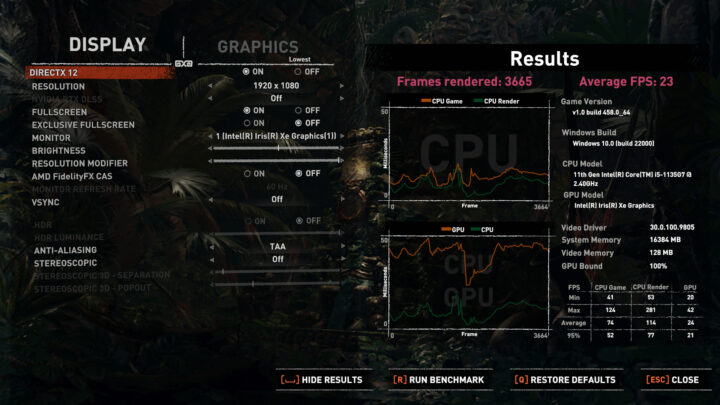
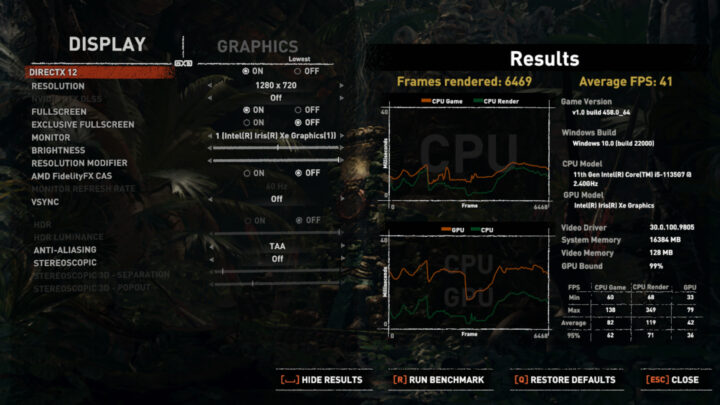
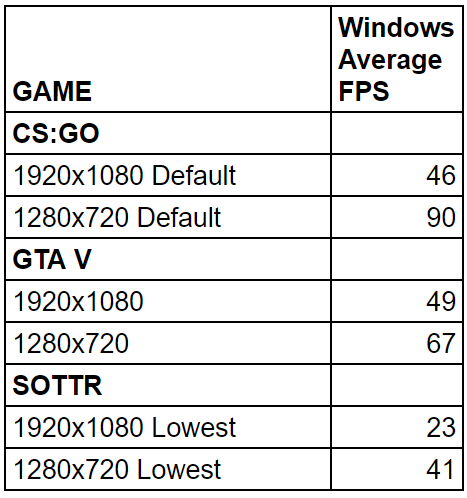
Given the impressive Unigine Heaven score, I decided to test three games under Steam (Counter-Strike: Global Offensive, Grand Theft Auto V, and Shadow Of The Tomb Raider) at both 1080p and 720p using default settings in both CS:GO and GTA V and with the graphical preset of ‘lowest’ in the built-in benchmark of SOTTR. The very respectable average FPS results were as follows:
It is worth noting that the i7 model of the GTi11 should perform even better given the iGPU’s 96 Execution Units versus the 80 in the i5 coupled with the CPU’s higher frequencies and larger cache.
Initial Observations
The Beelink GTi11 is impressive not only due to the combined CPU and GPU performance but also given the selection of ports available and the various storage configurations offered. In the second part, I’ll look at Linux performance using Ubuntu and also review the thermals, networking, and power consumption.
I’d like to thank Beelink for providing the GTi11 for review. It retails on Banggood at around $610 for the current i5/16GB/500GB configuration and $820 for the i7/32GB/500GB configuration.
Continue reading
- “Beelink GTi11 review – Part 2: Ubuntu 20.04 on an Intel Core i5-1135G7 mini PC“.
- “Beelink GTi 11 modding – PCIe Gen 4.0 M.2 slot, tweaking power limits, and eGPU” (Part 3)

Ian is interested in mini PCs and helps with reviews of mini PCs running Windows, Ubuntu and other Linux operating systems. You can follow him on Facebook or Twitter.
Support CNX Software! Donate via cryptocurrencies, become a Patron on Patreon, or purchase goods on Amazon or Aliexpress



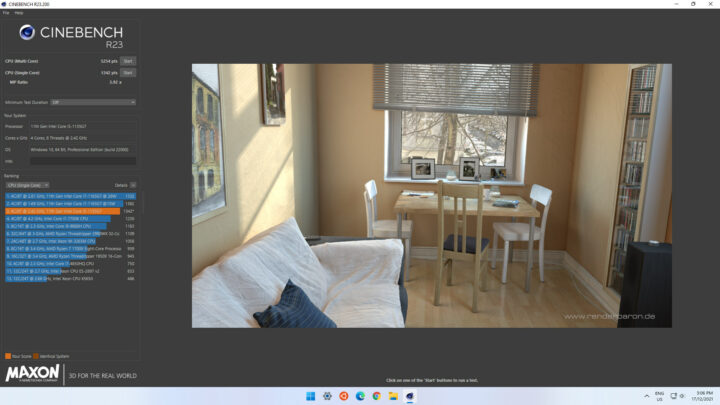




> Cinebench R23 which is becoming the de facto benchmarking version
Why exactly? Asides that the screenshot above shows R23 scores of 5254/1342 (made with Win10) while the picture with the results lists R20 scores of 2049/519 made with Win11. So you tested both and used one result here and the other there?
Interesting. I hadn’t picked up that a lot of the bechmark rresults including the games are showing Windows 10 even though they were all installed and then run on Windows 11.
Most of the reviews I see recently now use Cinebech R23 however as my comparison data is all based on Cinebench R20, I continue to use R20 so readers can compare with other mini PCs and I’ve included R23 for anyone who wants to know that particular benchmark result.
Normally in the quiet period of New Year / Chinese New Year I revisit all my benchmarks and upgrade some and retire others and then retest on recent mini PCs ready for the first review of the year. But it is a very tedious and thankless task and I’m wondering whether it is worth it.
> Most of the reviews I see recently now use Cinebech R23
If R24 would be available you would see this version starting to be used everywhere… by people who run benchmarks only in ‘fire and forget’ mode. Majority of reviews on the net is entertainment for consumers garnished with numbers and graphs (yours are fortunately a great exception from this rule).
R23 is the 1st Cinebench version that uses AVX on x86 if available. Many of those Mini PC you review lack these vector extensions. Let’s compare a recent Jasper Lake thingy with a recent i7:
Staring at R23 benchmarks (that are flawed for most of what users are really doing since which general purpose software makes use of AVX?) the N5100 achieves 24% single-threaded performance of the i7 (multi-threaded it’s just 7%).
When staring at Geekbench 5 numbers (also somewhat stupid but anyway) the N5100 is at 32%/13,5% of the i7’s performance.
Just by selecting the ‘right’ benchmark the energy efficient Atom almost doubles its relative multi-threaded performance compared to the i7. While in reality Cinebench R23 is only of interest for Cinema 4D users who do a lot of rendering. Since this specific benchmark only correctly represents this one niche use case.