Compilers like GCC OR LLVM normally do a good job at optimizing your code when processing your source code into assembly, and then binary format, but there’s still room for improvement – at least for larger binaries -, and Facebook has just released BOLT (Binary Optimization and Layout Tool) that has been found to reduce CPU execution time by 2 percent to 15 percent.
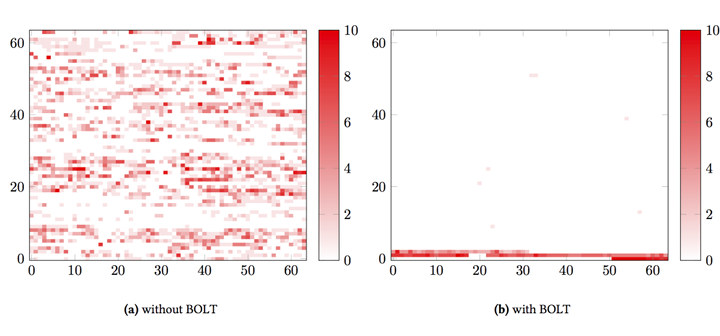
The tool is mostly useful for binaries built from a large code base, with binary size over 10MB which are often too large to fit in instruction cache. The hardware normally spends lots of processing time getting an instruction stream from memory to the CPU, sometimes up to 30% of execution time, and BOLT optimizes placement of instructions in memory – as illustrated below – in order to address this issue also known as “instruction starvation”.
 BOLT works with applications built by any compiler, including the popular GCC and Clang compilers. The tool relies on Linux perf tool to gather performance data, several LLVM libraries, and currently supports x86-64 and Aarch64 (ARM64) binaries. The company achieved 8% improvement for their HHVM (HipHop Virtual Machine) execution engine for the PHP and Hack programming languages.
If you’d like to try it yourself, you’ll find the tool source code, and instructions to build and run it in Github. If you’d also like to better understand how it works internally, you may want to read the white paper.
Via Phoronix

Jean-Luc started CNX Software in 2010 as a part-time endeavor, before quitting his job as a software engineering manager, and starting to write daily news, and reviews full time later in 2011.
Support CNX Software! Donate via cryptocurrencies, become a Patron on Patreon, or purchase goods on Amazon or Aliexpress


The graph clearly shows the effectiveness of BOLT at killing flying insects. All the ones flying around in the first graph are dead at the bottom of the second graph!
If they intended some other interpretation, perhaps they have labeled their axes. The text of the paper describes it as “Each block represents 36,188 bytes and the heat map shows how many times, on average, each byte of a block is fetched as indicated by profiling data. or example, the line at Y=0 from X=0 to X=63 plots how code is being accessed in the first 2,316,032 bytes of the address space. ”
Loosely translated, the X axis is the minor order of a fictitious address while the Y axis is the major. The intensity is also a fictitious logarithmic representation of access counts.
What a discover !
Someone can explain to facebook brains there there are other ways to “optimise and speed up” code, that we all should learn at school.
Like writing better, simpler and modular code in the first place.
Or using the ultimate weapon: assembly code.
Their approach is logical. It only takes a few brains to write a code optimizer. It takes many brains to write good code. So they prefer to have monkeys develop their applications and have the good brains fix and re-optimize all of this. Sadly this is how most large companies work nowadays. Sometimes you even see assembly being replaced by Java on a 10 times larger machine. From a technical point of view it hurts, but from a financial point of view, steel and silicon are cheaper than flesh and bones.
Moreover, this approach is applicably to any code — from large and bloated, to hand-optimised assembly. Humans are good at high-level algorithmic and micro-optimisation, but automata are better at the spectrum of optimisations in between — inlining, partial evaluation, loop unrolling, re-ordering. At the end if the day, it’s one thing to control the instruction locality in a small code, and quite another when that code spans several million loc.
Give me any easy way to gain even 1% in size or speed for free and I’ll use it.