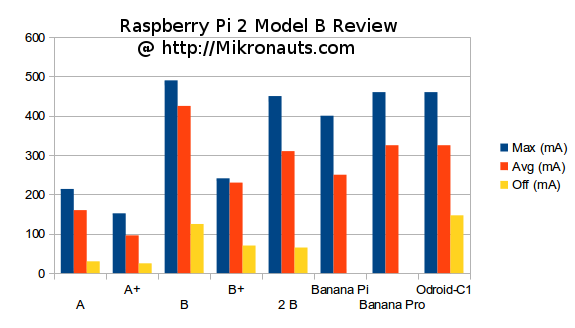
Mikronauts has recently reviewed MIPS Creator CI20, ODROID-C1, and Raspberry Pi 2 Model B. R-PI 2 review is especially interesting since this is the last one, and the reviewer goes to compare all Raspberry Pi models (A, A+, B, B+ and 2 B) with Banana Pi, Banana Pro, MIPS Creator CI20, and ODROID-C1 development boards. The benchmark results are good to know, and expected with ODROID-C1 the fastest of the bunch both in terms of CPU and storage performance, but here I’ll just share the results of his power consumptions testing.
 Since all platforms are powered by a 5V power supply, I’ve converted the results into watts.
| Model | Max (W) | Avg (W) | Off (W) |
| A | 1.07 | 0.80 | 0.15 |
| A+ | 0.76 | 0.48 | 0.125 |
| B | 2.45** | 2.12 | 0.62 |
| B+ | 1.20 | 1.15 | 0.35 |
| 2 B | 2.25 | 1.55 | 0.325 |
| Banana Pi | 2 | 1.25 | 0 |
| Banana Pro | 2.3 | 1.62 | 0 |
| Odroid-C1 | 2.3 | 1.62 | 0.735* |
* Connecting an ON/OFF switch to ODROID C1’s power header will allow for turning off the board completely (0W).
** Updated with correct value
For battery powered applications, Raspberry Pi A+ is clearly the best choice out of the list, ODROID-C1 and Raspberry Pi 2 Model B+ have quite similar power consumption values with a slight advantage to the latest Raspberry Pi model, except for soft power off where ODROID-C1 power consumption is about double.
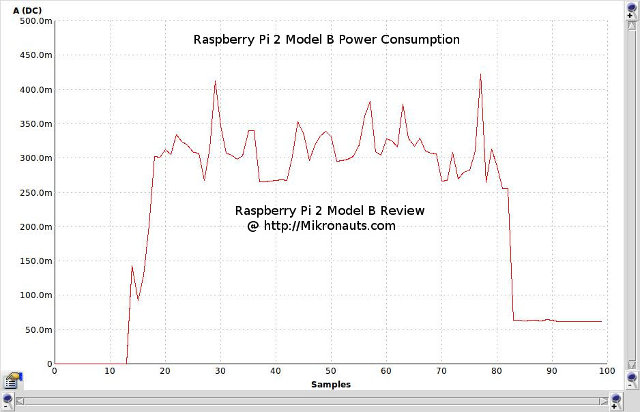
The downside of these measurements is that there’s no indication of the program(s) running during measurements. He only shared the following chart for the Raspberry Pi 2 Model B, which made me assume the measurements are made when the board is idled, and after power off.
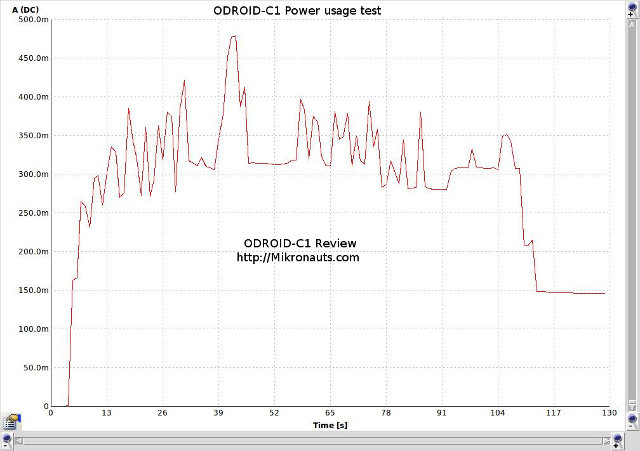
 However, looking at ODROID-C1 measurements, the chart looks a bit different with a spike, and the measurement duration is also longer (130 seconds vs 100 seconds), but this should not affect the conclusion that much.
 The procedure is also clearly explained with “the chart showing ODROID-C1 powering up, waiting a few seconds, opening the web browser, waiting a few seconds, and shutting down the desktop”.
Thanks to José for the links.

Jean-Luc started CNX Software in 2010 as a part-time endeavor, before quitting his job as a software engineering manager, and starting to write daily news, and reviews full time later in 2011.
Support CNX Software! Donate via cryptocurrencies, become a Patron on Patreon, or purchase goods on Amazon or Aliexpress


Clearly something is not right if the Avg (W) of the Model B Pi is higher than the Max (W). Otherwise nice benchmark.
@Jorg
also, measuring the raspberry pi power consumption gives me something around 4W with ethernet connection.
raspberry pi B
@kucho
It also depends where you measure. He has used a multimeter, so right after the power adapter. If you measure power consumption with a kill-a-watt, values should be higher because of the energy used by the power adapter. Not sure how much higher though.
well, this is the first time in my life i’ve seen a average higher than the max…
as they say, always learning 😉
Thanks for the article, interesting information.
Hi,
The error regarding avg/max is due to my typing in the wrong number 🙂
I went back to the original chart for the original model B at:
http://www.mikronauts.com/wp-content/upload/2014/08/Raspberry-Pi-B-Power-Chart.jpg
which is part of my Raspberry Pi B+ review at:
http://www.mikronauts.com/raspberry-pi/bplus-review/
The max should be ~490mA
Best Regards,
Bill
Hi,
Corrected chart:
http://www.mikronauts.com/wp-content/upload/2015/02/allpower.png
@William Henning
Thanks. I’ve updated the post too.