Although it it sometimes possible to debug applications using GDB (The GNU Debugger) on the target boards, there is often not enough memory available to run GDB on embedded systems running Linux.
To work around this issue, you can use gdbserver to perform remote debugging.
Installing and running gdbserver on the target board
First of all you need to install gdbserver on the target board. Assuming you use a Debian based distribution:
|
1 |
apt-get install gdbserver |
If you distribution, does not have binary repository, you can download gdb source code and cross-compile gdbserver.
Once gdbserver is installed, (cross-)compile your application in debug mode and start gdbserver as follows:
|
1 |
gdbserver target_ip:target_port prog_dbg |
Where target_ip and target_port are respectively the IP address of the board and the chosen TCP port, and prog_dbg, the program under test compile in debug mode (CFLAGS=-g).
Remote Debugging with GDB
If you are familiar with gdb and prefer to use the command line, you can use gdb for ARM. I’ll use a build machine using Debian Squeeze as an example.
Make sure you are using EmDebian pakages URL in /etc/apt/sources.list:
#
# — Emdebian cross toolchains
#
deb http://www.emdebian.org/debian/ squeeze main
|
1 2 |
sudo apt-get update sudo apt-get install gdb-arm-linux-gnueabi |
|
1 2 3 4 5 6 7 8 |
Unpacking gdb-arm-linux-gnueabi (from .../gdb-arm-linux-gnueabi_7.0.1-2_i386.deb) ... dpkg: error processing /var/cache/apt/archives/gdb-arm-linux-gnueabi_7.0.1-2_i386.deb (--unpack): trying to overwrite '/usr/share/gdb/syscalls/amd64-linux.xml', which is also in package gdb 7.0.1-2+b1 configured to not write apport reports dpkg-deb: subprocess paste killed by signal (Broken pipe) Errors were encountered while processing: /var/cache/apt/archives/gdb-arm-linux-gnueabi_7.0.1-2_i386.deb E: Sub-process /usr/bin/dpkg returned an error code (1) |
|
1 |
sudo dpkg -i --force-overwrite /var/cache/apt/archives/gdb-arm-linux-gnueabi_7.0.1-2_i386.deb |
|
1 |
target remote target_ip:target_port |
where target_ip and target_ip are the IP address and port stipulated in gdbserver command line.
After that, you can use gdb to debug the program normally. Simply type cont to run the program. For other commands type help or consult gdb manpage.
Installing and using Insight (GDB User Interface) for remote debugging
|
1 2 |
ftp://sourceware.org/pub/insight/releases/insight-6.8-1a.tar.bz2 tar xjvf insight-6.8-1a.tar.bz2 |
Then configure, build and install it to run on Intel x86 and support ARM targets:
|
1 2 3 4 |
cd insight-6.8-1 ./configure --host=i686-linux-gnu --target=arm-linux-gnueabi --disable-werror --prefix=/usr make sudo make install |
Now run arm-linux-gnueabi-insight without arguments.
Set the path where your ARM library are located. Click on View->Console to start the gdb console and type:
|
1 |
set sysroot=/usr/arm-linux-gnueabi |
where /usr/arm-linux-gnueabi is the sysroot path. The arm libraries are in /usr/arm-linux-gnueabi/lib directory in my case. This path depends on the cross-toolchain you use. I’m using EmDebian.
If you don’t set the sysroot, you’ll end up with dynamic library errors as you run the program. For example:
warning: .dynamic section for “/lib/libpthread.so.0” is not at the expected address (wrong library or version mismatch?)
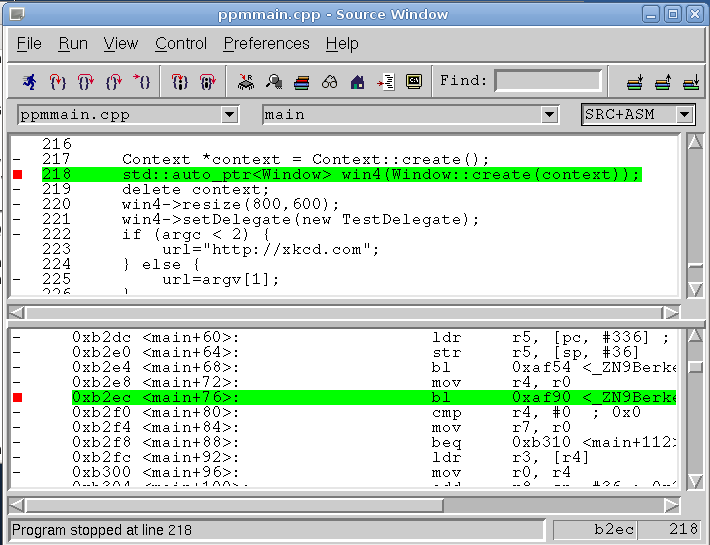
Click load your debug program by clicking File->Open, it will automatically load the source files and set a breakpoint in the main. You can also set your own breakpoints in the source (Red square in the screenshot below).

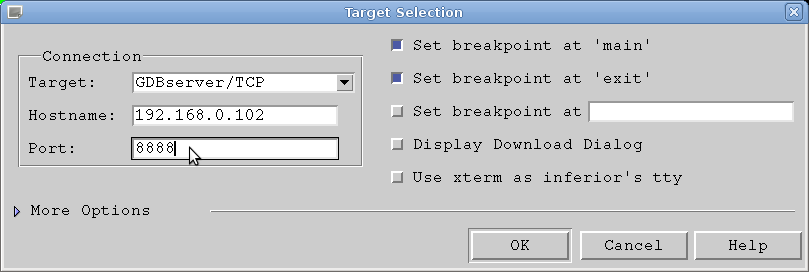
Click on Run->Connect to target and the Target Selection Windows should pop-up. Select GDBserver/TCP in the Target drop-down menu and enter the IP and port to connect to your board.

Click on OK. That’s it. You can now browse the code to add breakpoints, monitor variable….
To run the program, select Run->Run or Click on the “blue running man” icon.

Jean-Luc started CNX Software in 2010 as a part-time endeavor, before quitting his job as a software engineering manager, and starting to write daily news, and reviews full time later in 2011.
Support CNX Software! Donate via cryptocurrencies, become a Patron on Patreon, or purchase goods on Amazon or Aliexpress


This is a great article. Thanks a lot.