I wanted to record 24-hour of temperature data with eZ430-Chronos devkit and draw the result in a spreadsheet to see how the temperature evolves during the day. Here are the instructions to do so.
1. Update firmware to Chronos Datalogger.
In order to record temperature data in your eZ430-Chronos development kit, you’ll need to update the firmware to use Chronos Datalogger.
First start the Chronos Control Center, click on the Wireless Update tab, click on browse to select the Chronos Datalogger firmware file matching your hardware. In my case, I selected C:\Program Files\Texas Instruments\eZ430-Chronos\Recovery\Chronos Watch\Applications\eZ430_Chronos_Datalogger_433MHz_1_5.txt.
Then click on Update Chronos Watch. On the watch, press the # button several time to enter rFbSl mode and press the down button to start the wireless update.
2. Configure the watch for temperature logging.
Now start Chronos Data Logger software, click on Start Access Point. On your watch, press the # button to enter Sync mode and press the down button to enable communication.
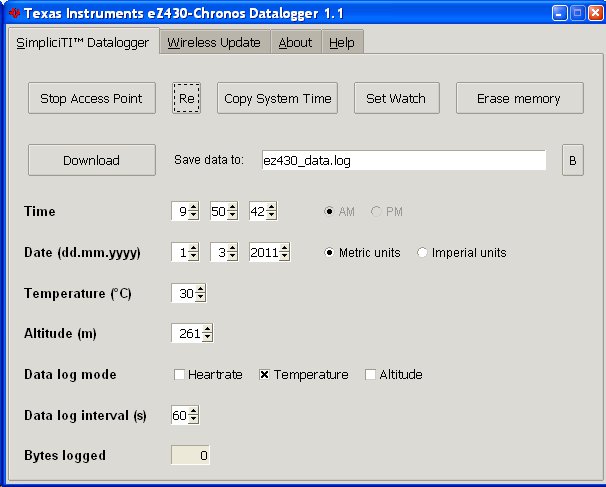
In Chronos Data Logger, press Read Data, enable Temperature data log mode, set the data log interval to 60 seconds and click on Set Watch.
 Click Read Data again to make sure the settings are correct. N.B: Some strings in the screenshot above are incomplete since Texas Instruments software does not support large font and non-default dpi settings.
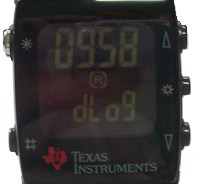
Back to the watch, click on the down button to disable wireless communication, place the watch where you want to measure temperature, ideally some places not exposed to the sunlight through the day, press the # button to enter dLoG mode (Data Logging Mode) and press the down button to start logging. The display on your watch should display a (R) icon to indicate data recording is in progress as shown on the picture on the right.
3. Retrieve data and display results.
After 24 hours, stop data logging by press the down button on the watch, press the # button to enter Sync Mode and press the down button to enable wireless communication.
In Chronos Datalogger software, start the access point, click on browse to select the file to save the data to and click download.
The data is recorded is available in temperature_data_24_March_2011.log
Disable wireless communication on the watch to save the battery power.
Rename to file with an csv extension, and double click on it to start Excel or scalc.
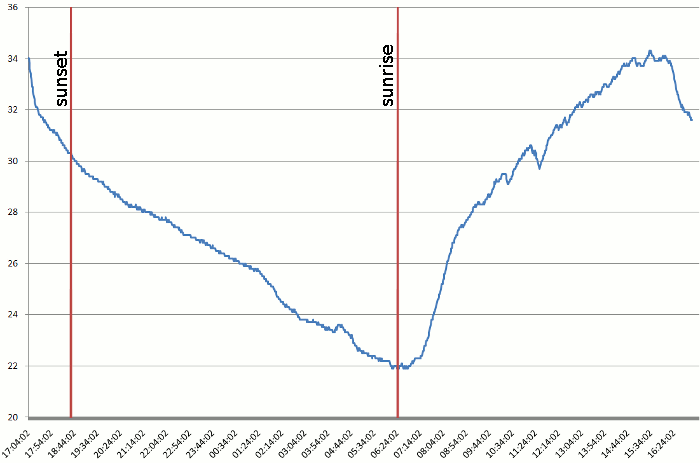
You can now draw the temperature profile as show below.
The record starts and ends at 17h00. The vertical scale is in degree Celsius.
We can see that the temperature goes down almost linearly during the night, stay stable around 30 minutes after sunset, before rising sharply until 14h00 and stays there until 16h00 before starting to decline (about 2h30 before sunset). Such profile could be used, for example, to decide when you want to set your air-conditioner to turn off at night. In that case, if you want to turn it off when the temperature reaches 24 degrees, you would set the turn off time at 3am.
4. Software and firmware improvement proposals.
If we’d like to do such recording regularly, the following improvement could be performed:
- Increase the logging interval to 5 or 10 minutes which would require to increase the counter variable to 16-bit in the firmware. This would allow longer period of data recording as the data logger memory is limited to 8KB.
- We now need to manually enable/disable wireless communication on the watch for the sake of the battery life, but we could configure the watch to enable / disable wireless communication and upload the data automatically at a fixed time (e.g. once a day, once a week…).
- The PC software would have to be modified to accept data upload and possibly reformat the data automatically.

Jean-Luc started CNX Software in 2010 as a part-time endeavor, before quitting his job as a software engineering manager, and starting to write daily news, and reviews full time later in 2011.
Support CNX Software! Donate via cryptocurrencies, become a Patron on Patreon, or purchase goods on Amazon or Aliexpress


Great article, thanks for the tips. Gonna try it in here soon!
I am looking for a contractor who could create a custom app for the Cronos watch. Any suggestions?
Hi, how do you get your time labels at the bottom of the graph to display like that?
does anyone know how to display them like that in matlab..
@ foof
Excel 2007: Right Click on the horizontal labels and select “Format Axis”, then enter a value that suits your need in “Specify interval unit”
Hi !
great article.I’m just starting with the ez430 and if you have any informations/links to share, I’d happily welcome them.
@ Christophe C.
I’ve have not really spent time developing on the platform, but I suppose good links to get started would be:
The Wiki: http://processors.wiki.ti.com/index.php/EZ430-Chronos?DCMP=Chronos&HQS=Other+OT+chronoswiki
MSP430 development community: http://e2e.ti.com/support/microcontrollers/msp43016-bit_ultra-low_power_mcus/f/166.aspx
I have eZ430 chronos and want to try data logger. Unfortunately, I cannot enter dLoG mode when I pressed # button. Do I have to do something before doing this. My ez430 is still new. Thanks