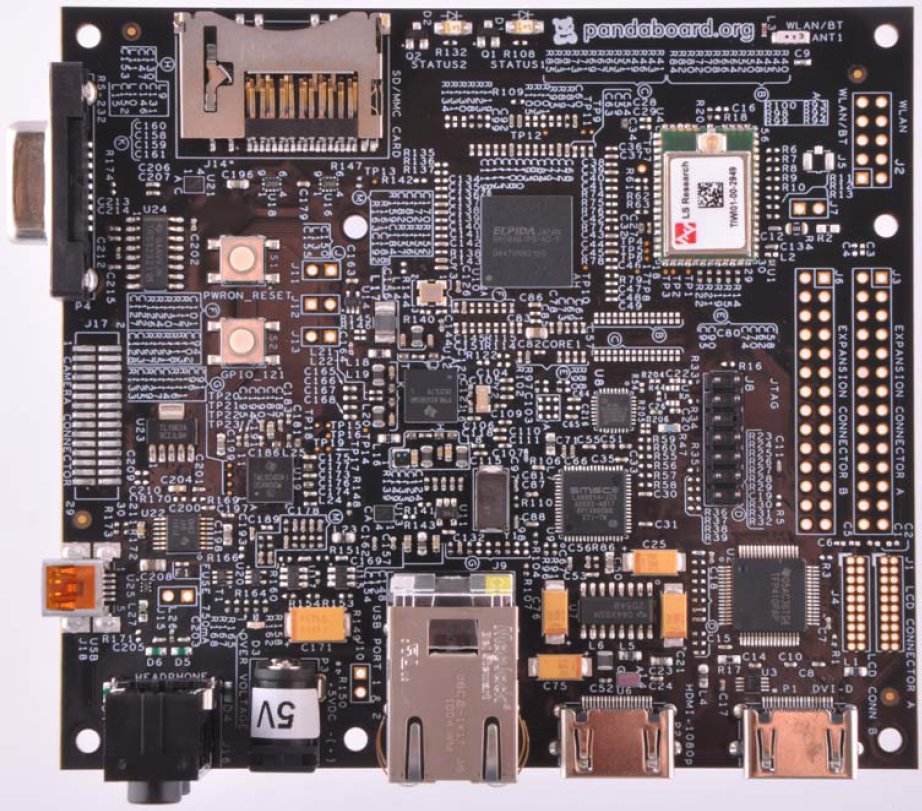
Somehow I’ve missed the announcement of the Pandaboard ES – a new version of the Pandaboard low cost development board – last month. The Pandaboard ES is built around OMAP4460 processor running at 1.2 GHz with 1GB RAM and an SD/MMC card slot. It features onboard 10/100MBit Ethernet, Wifi, Bluetooth, several video output ports (HDMI, DVI-D, LCD Expansion and DSI), audio input/audio, several expansion ports (USB 2.0 OTG, USB 2.0 host, GPIO header, camera header..) and debug ports (JTAG, UART, 2 status LEDs, 1 GPIO button and sysboot switch). It has the same form factor as the original Pandaboard (114.3mm x 101.6mm) and weights 81.5g instead of 74g for the Pandaboard. The cost is however slightly higher at 182 USD (recommended price) vs. 174 USD for the Pandaboard. To help you choose which board is best for you, I’ve created a table comparing Pandaboard and Pandaboard ES specifications and features. […]
Android 4.0 Demo on Ziilabs Jaguar Tablet Reference Design
Yet another Android 4.0 demo on a development platform. This time, Android 4.0.1 runs on a Jaguar Tablet powered by Ziilabs ZMS-20 ARM Cortex A9 processor. It runs pretty smoothly.
ARM Releases Free DS-5 Community Edition For Android Developers
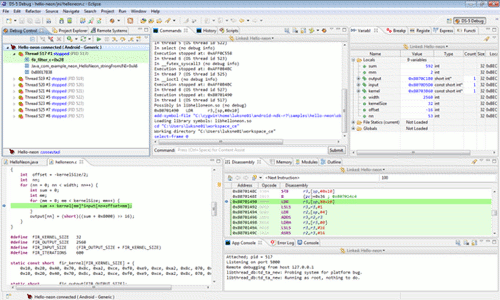
ARM announced a free version of its Eclipse-based DS-5 tools for small development firms (with 10 or fewer developers) and individuals who publish applications for Android. The ARM Development Studio 5 (DS-5) Community Edition (CE) helps create performance- and power-optimized native software by integrating a graphical debugger for code generated for the Android Native Development Kit (NDK) and a basic version of the ARM Streamline performance analysis tool. DS-5 CE is designed to work with Android Virtual Devices ( AVDs), development boards and devices that run Android 2.2 and API 8 or higher. ARM Development Studio 5 (DS-5) Community Edition is distributed as plug-in for Eclipse and completes the app developer toolkit with a C, C++ and Assembly graphical debugger that builds on the Android Debug Bridge (ADB), a software performance profiler and system analyzer (ARM Streamline). To get started, you’ll need Eclipse IDE, the Android SDK and the Android NDK […]
Nokia Developer Day in Chiang Mai – 6-7 December 2011
Nokia Developer Day will take place at Kantary Hills in Chiang Mai, Thailand on the 6 & 7 December 2011. A Separate event will also take place in Khonkaen on the 8 & 9 December 2011. Here’s the agenda for the 2 days event in Chiang Mai: Day 1 – 6th of December: 08:45 – 09:15 – Registration 09:15 – 09:30 – Introduction to Ecosystem Business Updates 09:30 – 09:50 – Development possibilities on Nokia Platforms 09:50 – 12:30 – Introduction of Series 40 Java – Touch & Type with hands-on exercises. 12:30 – 13:30 – Lunch 13:30 – 16:00 – Series 40 Web Apps for the next billion with hands-on exercises. 16:00 – 17:00 – Social Media Marketing Training 17:00 – Q&A Day 2 : 7th of December 08:45 – 09:15 – Registration 09:15 – 10:00 – Overall business direction 10:00 – 12:00 – Introduction to Qt Quick (QML) […]
ARM NEON Tutorial in C and Assembler
The Advanced SIMD extension (aka NEON or “MPE” Media Processing Engine) is a combined 64- and 128-bit single instruction multiple data (SIMD) instruction set that provides standardized acceleration for media and signal processing applications similar to MMX, SSE and 3DNow! extensions found in x86 processors. Doulos has a video tutorial showing how you can exploit NEON instructions in assembler, how to modify your C code and provides the compile options for gcc to enable NEON during the build. Abstract: With the v7-A architecture, ARM has introduced a powerful SIMD implementation called NEON™. NEON is a coprocessor which comes with its own instruction set for vector operations. While NEON instructions could be hand coded in assembler language, ideally we want our compiler to generate them for us. Automatic analysis whether an iterative algorithm can be mapped to parallel vector operations is not trivial not the least because the C language is […]
World’s First Android 4.0 Tablet is based on Rockchip RK2918
Rockchip has announced Android 4.0.1 (ICS) would be ready by the first week of December with Rochchip RK2918 based tablets shipping with the new OS available later in December. The company claims this will be the first Android 4.0 tablet available in the market. That also means that owners of Archos Arnova G2 tablets should be able to run Android 4.0 very soon. The demo below seems relatively smooth compared to other demos I have seen on development boards such as ST Ericsson Snowball, so I suppose Rockchip has already enabled hardware acceleration.
400 Free Raspberry Pi (Development) Boards for Qt 5 Developers
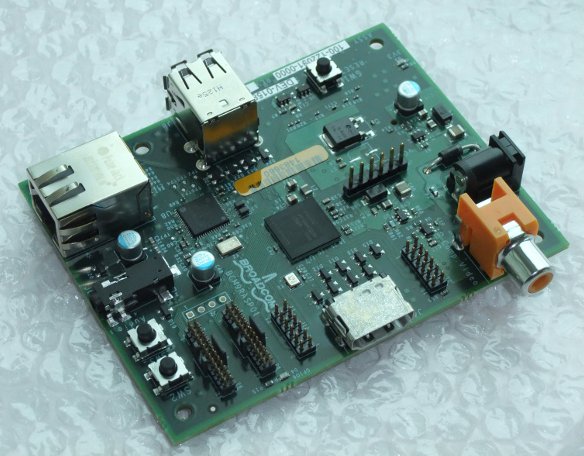
Remember the 25 – 35 USD ARM11 board Raspberry Pi ? Nokia is now getting involved and plans to speed up Qt 5 development on this nice little hardware. The Raspberry Pi Foundation has announced that Nokia would purchase 400 boards next month and give them away to Qt 5 developers who are willing to port software, develop apps, and test and improve the Qt 5 Linux stack. Mostly likely it will be the “high-end” 35 USD version with Ethernet support and 2556 MB RAM as show below. Beside its ridiculously cheap price, the board key features include Linux support, embedded GPU and OpenGL ES libraries that makes it a usable multimedia device capable of outputting 1080p. Nokia and ICS engineers have already started to port Qt to the Raspberry Pi board using the alpha boards. You can see the Qt Quick 2 emitter demo below running on one of the […]
Linaro 11.11 Release with Kernel 3.1.1 and Android 4.0.1 Support
Linaro has just released version 11.11 based on Linux Kernel 3.1.1 and with support for Android ICS. The Android 4.0.1 Preview build for all low cost development boards supported by Linaro are available at http://releases.linaro.org/11.11/android/images-ics-preview/. Here are the highlights of the release: Android Linaro’s baseline has now been upgraded to 2.3.7. The first Versatile Express Android build has been completed. Pandaboard and Vexpress has been upgraded to kernel 3.1.1. A preview of Ice Cream Sandwich is released and running on Snowball, Origen, iMX53 and on Pandaboard with Linaro kernels. A NEON-optimized libpng has been itegrated in all builds. Preliminary DS-5 support has been integrated. Preliminary WiFi support on Android Origen. Kernel config for each build is available on android-build page. USB Ethernet works on Origen. Camera recording function works on Pandaboard. USB camera can be hotplugged on Pandaboard. Developer Platform Firefox can now be cross-built using multiarch. Instructions are available […]


