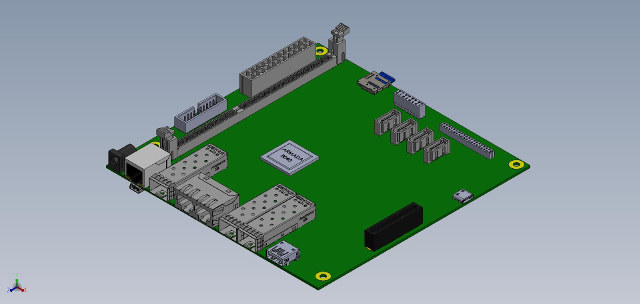
Developers interested in ARMv8 server or networking boards are starting to have more and more affordable choices. After AMD Opteron A1100 series based LeMaker Cello board, and Softiron Overdrive 1000 server, SolidRun is now working on ARMADA 8040 networking community board powered by Marvell ARMA8040 quad core Cortex A72 network processor. ARMADA 8040 networking board (mrvl8040) preliminary specifications: SoC – ARMADA 8040 (88F8040) quad core Cortex A72 processor @ up to 2.0 GHz with MoChi architecture System Memory – 4GB DDR4 DIMM by default Storage – 4x SATA 3.0 port + micro SD slot Connectivity – 1x Gigabit RJ45 port, 1x SFP SGMII @ 2.5Gbps, dual 10Gbps copper with auto switchover to dual SFP+ Expansion – 1x PCIe-x4 3.0 slot, Linaro 96Boards expansion slot exposing GPIO, UART, I2C and SPI, Marvell TDM module header USB – 1x USB 3.0 port, 2x micro USB ports Debugging – Console port (UART) over […]
STMicro Releases Linux based STM32 MCU Development Tools
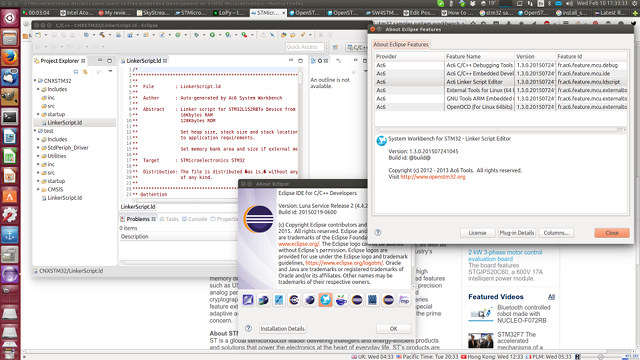
Until a few years ago, most development tools for micro-controllers were only available for Windows, but as Linux gained popularity among developers and engineers, community of developers designed development tools running in Linux, but only a few companies are providing tools that run on Linux operating systems. The good news is that STMicro has just announced the release of STM32CubeMX configurator and System Workbench for STM32, for both Linux and Windows, with Mac OS supporting coming on Q2 2016. Developped by Ac6 embedded systems company, System Workbench for STM32 relies on Eclipse IDE, supports the ST-LINK/V2 debugging tool under Linux through an adapted version of the OpenOCD project, and can be used with various STMicro STM32 boards including Nucleo boards, Discovery kits, and other Evaluation boards. You can give it a try by visiting OpenSTM32 Community, but for some reasons they ask you to register before accessing the installation instructions. […]
Beyond Debug Key Enables JTAG & UART Debugging, Supports OpenOCD
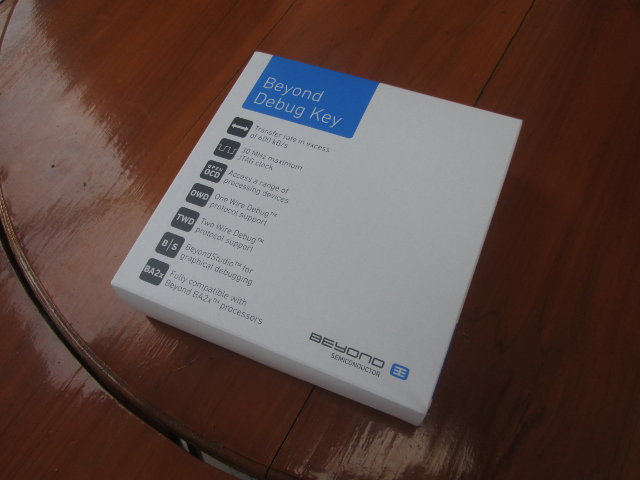
Beyond Semiconductor, a fabless semiconductor company based in Slovenia which develops their own 32-bit BA2x IP cores, has sent me one of their development tool, namely Beyond Debug Key supporting JTAG and UART interfaces either with BeyondStudio for the company’s BA2x processor, or the open source suite OpenOCD for other processors. Since I don’t have any Beyond Semi boards, I instead configured it, and quickly tried it with Atmel SAMA5D3 Xplained ARM Cortex A5 development board, and OpenOCD (Open On-Chip Debugger). The debug tool comes in the package above describing the key features of the kit: Performance Transfer rate in excess of 600 kB/s 30 MHz maximum JTAG clock Less than 20 μW power draw from target board Compatibility Fully compatible with Beyond BA2x processor family Access any 8-bit, 16-bit, 32-bit or 64-bit processors via JTAG Works with all JTAG compliant devices Software Support OpenOCD for access to a range […]
OpenOCD: Hardware Debugging and More – ELCE 2012
Peter Stuge, self-employed hardware, software and security consultant, talks about OpenOCD open source tool for JTAG debugging at ELCE 2012 in Barcelona. Abstract: The presentation walks through how to use the OpenOCD open source software to debug embedded systems on the hardware level via JTAG interface, allowing single stepping, setting breakpoints, inspecting register and memory contents and more, starting before the CPU even executes the first instruction. After an introduction to JTAG debugging we look at how to use OpenOCD both standalone for firmware flashing as well as together with the GDB GNU Debugger for convenient debugging of bootloaders or the Linux kernel. These tasks will be demonstrated, and the respective OpenOCD configuration details will be explained.The presentation targets intermediate-level developers who work on bootloaders, BSPs and kernel drivers, deeply embedded systems, and test and production engineers with an interest in using OpenOCD, which can allow unified tooling across all […]
Using OpenOCD JTAG in Android Kernel Debugging – Android Builder Summit 2012
Mike Anderson, CTO and Chief Scientist for The PTR Group, gives a tutorial about Linux kernel debugging in Android with OpenOCD JTAG at the Android Builder Summit in February 2012. Abstract: Owing to the use of the Linux kernel, Android device drivers can be debugged using many of the same techniques as Linux. Still, much of the user-space interface code typically found in Linux is missing in Android. This complicates the debugging of kernel driver code. This presentation will demonstrate the use of the open on-chip debug (OpenOCD) software and an inexpensive JTAG to debug Android kernel code. The target audience for this presentation are platform developers looking to debug their kernel code such as device drivers. This presentation is targeted at intermediate-level developers with some understanding of kernel code development. You can also download the presentation slides on linuxfoundation.org website. Jean-Luc Aufranc (CNXSoft)Jean-Luc started CNX Software in 2010 as […]
Linux Kernel Debugging – Linaro Connect Q4 2011
Linaro Connect Q4.2011 takes place on the 31 October – 4 November 2011 in Orlando. In the video below, Linaro toolchain developers asked kernel developers about their potential needs for kernel debugging. Several options to improve the kernel debugging experience were discussed. In particular, the toolchain group will make sure that OpenOCD works at least on one of the member boards to allow for easy debugging through JTAG. They also mentioned support for o-profile. This session was an opportunity to review debugging techniques used by kernel developers. It also allowed most participants to discover the GDB Text User Interface (GDB TUI), a very convenient way to interact with GDB, without having to go through heavyweight environments like Eclipse. You can follow this subject on Blueprints for Toolchain support for Kernel Debugging on Linaro website. The audio is quite poor, so use some headphones or boost the volume to hear anything. […]


