LinuxCon (North America) 2012 will take place on August 29 – 31, 2012 at Sheraton Hotel & Marina, in San Diego, California. The event will be co-located with the Linux Kernel Summit, the Linux Plumbers Conference, and CloudOpen 2012. LinuxCon consists of 3 days of keynotes, business and developers related sessions as well as tutorials. There will be over 80 sessions and keynotes during those 3 days. I’ll highlight a few sessions that I find particularly interesting and related to embedded Linux, software development and ARM. August 29 10:45 – 11:30 – Life After BerkeleyDB: OpenLDAP’s Memory-Mapped Database by Howard Chu, Symas Abstract: OpenLDAP’s new MDB library is a highly optimized B+tree implementation that is orders of magnitude faster and more efficient than everything else in the software world. Reads scale perfectly linearly across arbitrarily many CPUs with no bottlenecks, and data is returned with zero memcpy’s. Writes are on […]
Quick Binary Debugging in Linux with Strace System Call Tracer
I’ve recently come across strace, a debugging utility for Linux that “monitor the system calls used by a program and all the signals”. It may not be that useful if you have the source code and can run other debugging tools such as gdb, or simply add printf to your code. But if you don’t have source code of the program, or you are a system administrator who wants to check if the program fails due to file access reasons, for example, this is really a great tool as it may help you find out which file causes problem. In my case, I was trying OpenGL ES on an ARM platform, and at least part of the code comes in libraries that are only available in binary form. I got the following error message running es2_info (part of mesa-utils-extra): UMP: ump_arch_open() failed to open UMP device driver ********************************************************************* ERROR: In […]
Ubuntu, Tizen, XMBC… Demos at Q2.12 Linaro Connect in Hong Kong
Linaro has announced several demos would take place at Linaro Connect on June 1st, 2012 in Hong Kong: Big.LITTLE in-kernel Switcher (Linaro) SIProp – Combat Scouter – How much your Combat Power? (SIProp) Android Toolchain Improvements (Linaro) Origen Running Awesome Code (Linaro) Snowball with MM enablement (Linaro) Tizen on Snowball (Linaro) Google+ Hangouts on an ARM Board (Linaro) Low-Cost Logic Analyzer (Linaro) XBMC on Snowball – ST Ericsson Snowball (Linaro) (Ubuntu) Unity 3D on Snowball (Linaro) Ubuntu TV on Snowball (Linaro) PCM (Phase Change Memory) : Linaro kernel meets with the PCM technology (Micron) ARM DS-5 & Linaro (ARM) Most of the demos will be organized by Linaro, but three others companies will also shown the “show”, namely SIProp, Micron and ARM. It’s always interested to see what happens at Linaro because it gives a view into the future to what may comes to the new products and developers can see what new features are available for […]
IAR Systems I-jet Hardware Debugging Probe Is Now Available
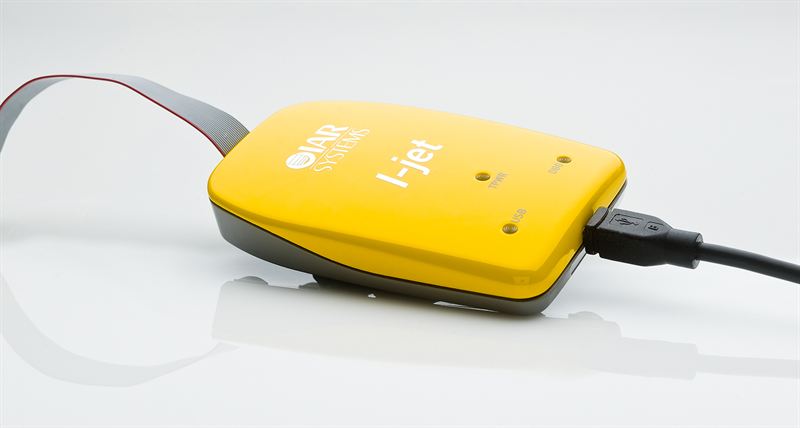
IAR Systems has announced the availability of I-jet, a new in-circuit debugging probe that can be used in conjunction with Embedded Workbench for ARM, IAR C/C++ compiler and debugger tool suite. I-jet provides download speeds of up to 1 MB per second, JTAG and Serial Wire Debug (SWD) clocking at up to 32 MHz (no limit on the MCU clock speed), and Serial Wire Output (SWO) frequencies of up to 60 MHz. I-jet probe is powered by USB and can also power the target board (Up to 400mA) and measure the power consumption accuratly (200 uA @ 200khz). The probe is plug-and-play, and supports automatic core recognition, and direct download into the flash memory. I-Jet supports ARM7, ARM9, ARM11, ARM Cortex-M, ARM Cortex-R4, and ARM Cortex-A5/A8/A9 cores. Serial Wire Viewer (SWV), Embedded Trace Buffer (ETB) and JTAG adaptive clocking are supported and all JTAG signals can be monitored. The probe […]
VWorks VLAB Powers Freescale Vybrid Virtual Platform
Back in March, Freescale announced their Vybrid solution featuring both a Cortex A5 processor and a Cortex M4 microcontroller, and they had prototypes running an unnamed virtual platform in order to speed up software development and possibly have the software ready at the same time as the silicon is. Always looking to learn more, I studied and wrote about virtual hardware platforms such as Cadence Virtual System Platform, Wind River Simics Virtual Platforms and the open source Imperas OVPsim simulator. It turns out Freescale does not use any of these solutions, but relies on VWorks VLAB instead, which still use the same standard (SystemC/TLM) as the virtual hardware solutions aforementioned. VWorks uploaded a demonstration of VLAB running a virtual platform for the Freescale Vybrid controller and showing how it can handle both ARM Cortex-A5 and Cortex-M4 cores. This demo of VLAB 1.7.0 is pretty interesting and showcases: Dual (virtual) display […]
ARM Development Studio 5 (DS 5) Demos At Design West
ARM has shot a few video demos of their ARM Development Studio 5 (DS 5), a software development tool suite for ARM platforms, at Design West 2012. The first video shows DS 5 running on the Xilinx Zynq-7000 platform (dual cortex A9 + FPGA), and we can see the memory map, registers, call graphs and stack usage. We can also see real-time processor switching and the function that takes the most CPU resources (profiling). The second videos showcases ARM DS-5 Streamline, a performance analyzer, which helps determine how well programs are running on a Linux or Android platform, on an Samsung Exynos 4210 platform (Origen board?). This tool also to profile both the dual-core ARM Cortex-A9 and ARM Mali-400 MP GPU in the platform. We are shown three types of reports: CPU/GPU Loading Threads usage Power Usage per application The third and last video shows ARM DS 5 on Freescale i.MX6 […]
ADB: (Android Debug Bridge) : How It Works – Android Builder Summit 2012
Tetsuyuki Kobayashi, working at Kyoto Microcomputer a Japanese development tool vendor, explains how the ADB (Android Debug Bridge) works at Android Builder Summit in February 2012. Abstract: ADB is very nice and important tool. Every Android Builders uses adb command such as ‘adb shell’ and ‘adb logcat’. But what does it mean ‘adb kill-server’ ? I studied the source code of adb. I share you how adb works and some tips I found. This session is for developers who want to know Android internal deeply. You can also download the presentation slides on linuxfoundation.org website. Jean-Luc Aufranc (CNXSoft)Jean-Luc started CNX Software in 2010 as a part-time endeavor, before quitting his job as a software engineering manager, and starting to write daily news, and reviews full time later in 2011. www.cnx-software.com
Linux Debugging: Listing Shared Libraries at Runtime
I had a library (a python plugin) that crashed and outputted the “very useful”: illegal instruction I tried pdb (the Python Debugger) to find the issue without success. So I tried to add some printf to this library but none were outputted at runtime. So I guessed the illegal instructions was generated by the shared libraries. Let’s see how many libraries we’ve got: ldd libbrowsernode.so | wc -l 125 Oh dear!… 125 libraries.. This is where panic sets in. Luckily, there is a simple way to list the dynamic libraries as they are loaded (and some more useful info). Simply set: export LD_DEBUG=files before running your program. This is extremely verbose, so I recommend you redirect the output to a file. This method allowed me to find undefined symbols during dynamic libraries load time with errors such as: opening file=/usr/lib/gtk-2.0/2.10.0/loaders/libpixbufloader-png.so [0]; direct_opencount=1 14121: 14121: /usr/lib/gtk-2.0/2.10.0/loaders/libpixbufloader-png.so: error: symbol lookup error: undefined […]


