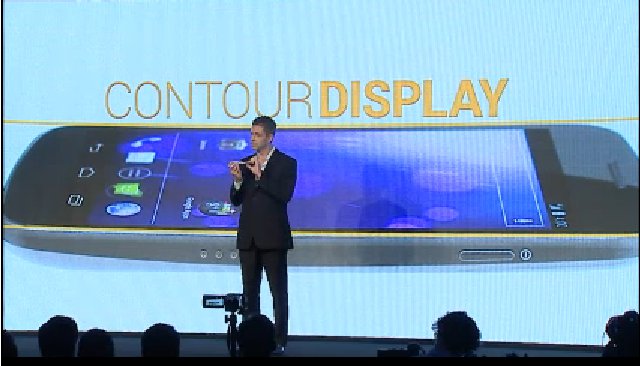
Samsung and Google jointly announced the very first Android 4.0 (ICS) smartphone in Hong Kong. They did not get too original to name the device. Remember the Nexus S and Galaxy S series? Well, the smartphone is named Galaxy Nexus. The phone features a dual-core Texas Instruments OMAP4460 processor, a 4.65″ super AMOLED plus display (1280×720), LTE/HSPA+ network support, 1080p video recoding, NFC, barometer and more. It will be sold in the US, Europe and Asia (including Japan and China) in November. After Samsung showcased the smartphone, Google presented the new Android 4.0 (ICS). 3 Design principles: Beautiful: Enchant me Easy: Simplify my life Powerful and Smart Here are the main points I gatherer of Android 4 presentation: The new UI uses the Roboto font. They removed the physical buttons on the smartphone. Everything is now done with gestures. It looks like Honeycomb for smartphone with stacks and widgets. Widgets […]
Samsung Galaxy S3 to be based on Exynos 4212 Processor
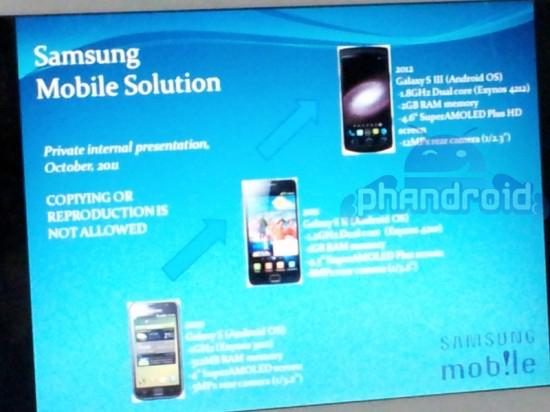
A picture which the next Samsung Galaxy S3 has been leaked on the Internet. Phandroid has posted a screenshot of what are being rumored to be the specs of the Galaxy S III. The Samsung Galaxy S3 should have the following specs: 1.8 GHz dual-core processor (Exynos 4212) 2GB RAM Android OS (I suppose ICS) 4.6″ SuperAMOLED Plus HD display 12MP Rear Camera The phone will be available sometimes in 2012 Jean-Luc Aufranc (CNXSoft)Jean-Luc started CNX Software in 2010 as a part-time endeavor, before quitting his job as a software engineering manager, and starting to write daily news, and reviews full time later in 2011. www.cnx-software.com
Android 2.3.7 (Alpha) for HP TouchPad Has Been Released
CyanogenMod team has just released the CyanogenMod 7.1 port for the HP TouchPad. This is an initial alpha release, so there are still plenty of bugs and a few non-working features, but overall it should be in a state that you can at least play around with Android on your TouchPad. For this release they used a new experimental installer called the Alpha CyanogenMod Experimental Installer (ACMEInstaller). This installer will reorganize partitions on the flash (resize the WebOS media volume to make room for Android).ACMEInstaller will be used to install ClockworkMod Recovery, CyanogenMod 7.1 and the new Moboot bootloader. After installation you’ll be able to boot WebOS or Android (dual-boot). The firmware currently support the following features: GPU acceleration 1080p video playback Wifi(with caveats) Bluetooth(no headset profile) Touchstone dock support Audio As it is alpha, there are also plenty of known issues including: Higher than normal battery drain, ~2%/hr while […]
CubeStormer II Solves The Rubik’s Cube in 5.352 Seconds
Do you remember the ARM Android Based Rubiks Cube Solver ? Last year it could solve the puzzle in an average of 15 seconds. David Gilday has upgraded its robot with the help of Mike Dobson and named the device CubeStormer II. They released a video showing the CubeStormer II solve the Rubik’s Cube in 5.352 seconds, faster than the human world record (5.66 seconds). The mechanics are constructed entirely from LEGO, including four MINDSTORMS NXT kits, with the addition of a Samsung Galaxy S II smartphone running a custom Android app as the robot’s brain. The app uses the phone’s camera to capture images of each face of the Rubik’s Cube which it processes to determine the scrambled colours. The solution is found using an advanced two-phase algorithm, originally developed for Speedcuber (originally developed by Mike Dobson), enhanced to be multi-threaded to make effective use of the smartphone’s dual-core […]
Running Android Apps in Windows 7 with Bluestacks App Player
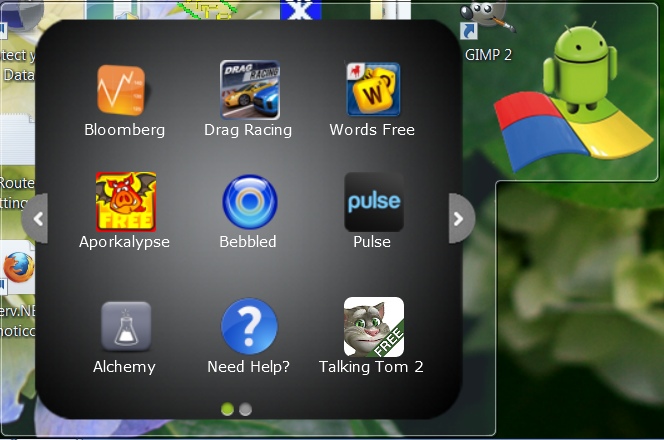
Bluestacks has released an Alpha version of its App Player for Windows 7. This sotware allows you to run Android apps inside Windows 7. I’ve tried to install it in Windows XP but it won’t work and here’s the reason: So Bluestack App Player is a Windows 7 gadget, so it would obviously not work in Windows XP. If you want Windows XP, you do not need to despair as you can still run Android-x86 in a virtual machine (The post is a bit old, Android 2.3 is now available). Of course, this is not as neat and fast as Bluestacks application. There are 10 applications pre-installed. I’ve tried Bloomberg app and it works very well. If you need more apps, you can visit Bluestacks Channel and add up to 16 extra applications. The pro-version will not have this limitation and will allow users to install premium apps such a […]
New Android 2.3.4 Release For ST Ericsson Snowball Development Board
Igloo Community – the team developing for ST Ericsson Snowball Nova A9500 development board – has released the second version of Android 2.3.4 for the board. It can be downloaded at http://igloocommunity.org/download/android/images/20111012/ for V3 and V5 boards. Here are the new features and main bug fixes for this release: GPS support enabled WiFi instabilities fixed and enabled in the UI The browser home page crash is gone and the known issues: Audio recording does not work Potrait mode does not work (rotating the device corrupts screen until rotated back) The phone app crashes (no modem support) The flashing instructions are available at http://www.igloocommunity.org/support/Flashing_howto Jean-Luc Aufranc (CNXSoft)Jean-Luc started CNX Software in 2010 as a part-time endeavor, before quitting his job as a software engineering manager, and starting to write daily news, and reviews full time later in 2011. www.cnx-software.com
MontaVista adds HTML5 and Android support to its GENIVI-Compliant Automotive Technology Platform
Montavista announced secure HTML5 and Android support to its Automotive Technology Platform (ATP) which is GENIVI Compliant. HTML5 support is provided via MontaVista’s ModiiTM Digital Media Solutions Platform. Both Android and HTML5 are made independant of critical part of the software as they are executed in a MontaVista Linux Container (isolated virtualized container environment). Here’s an excerpt of the press release: SANTA CLARA, Calif. – October 10th, 2011 – MontaVista® Software LLC, today announced secure HTML5 and Android support for its Automotive Technology Platform (ATP). The addition of HTML5 support is provided via MontaVista’s ModiiTM Digital Media Solutions Platform which adds a powerful HTML5-based UI Framework to its recently released GENIVI-Compliant Platform. The Android support delivers a high performance Android runtime environment, which opens up access to a vast number of popular applications from the entire Android ecosystem. Complementing the Android and HTML5 capabilities, MontaVista has implemented a unique dual-layered […]
CyanogenMod 7.1 Android Released
CyanogenMod Team has just released CyanogenMod 7.1 based on Android 2.3.7. The previous version (7.0.3) was released on the 6th of May 2011. CyanogenMod 7.1 Changelog Common: Android 2.3.7 (Google) Common: Bluetooth mouse support – Scott Brady Common: Improve notification swipe-to-clear – Evan Charlton Common: Improve album-artist support in media scanner – Paul Crovella Common: Profile improvements and bugfixes – Martin Long, Danny Baumann, Robert Burns Common: RTL text improvements – Eyad Aboulouz, Eran Mizrahi Common: Wake on volume key option – Sven Dawitz Common: Support for revoking application permissions – Plamen K. Kosseff Common: Latest Superuser app – ChainsDD Common: Control brightness by sliding on statusbar – Danesh M Common: Add “copy all” to context menu – Danesh M Common: Lockscreen haptic and statusbar indicators toggle – Danesh M Common: Nicer timepicker/datepicker – Jiri Tyr Common: Configuration 0/90/180/270 rotation – Jonas Larsson, Scott Brady Common: DSP Manager bugfixes and […]


