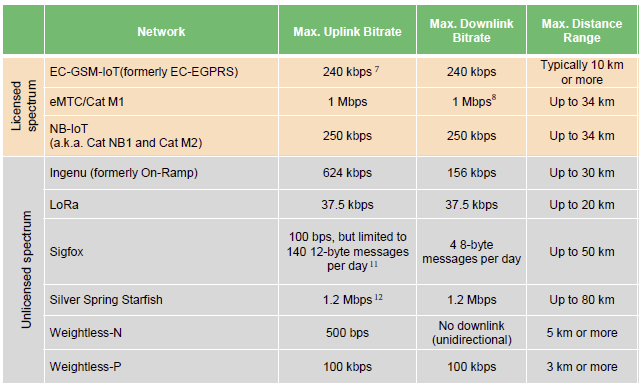
LoRaWAN, Sigfox, Weightless, RPMA, NB-IoT, etc… There are many LPWAN (Low Power Wide Area Networks) solutions, but it’s unclear whether most/all will survive and coexist, or there will eventually be a couple of winners used by everyone. VDC Research is claiming that so far, LoRaWan assumes LPWAN leadership for IoT gateways, explaining that “LoRaWAN (LoRa) has generated considerable traction with new product launches from a number of gateway suppliers through the past 18 months”, but points to mounting competition from 3GPP standards such as NB-IoT and LTE Cat M1. Sadly, the company did not provides number in their public announcement, and those are only available in the paid report. VDC Research still released a public executive brief (free registration required), with some of the highlights including: The global market for IoT gateway hardware is forecasted to grow to more than $2.5B in 2021. While intelligent gateways generated more market revenue […]
NanoPi NEO Core and NEO Core2 Allwinner H3/H5 Systems-on-Module Launched for $7.99 and Up
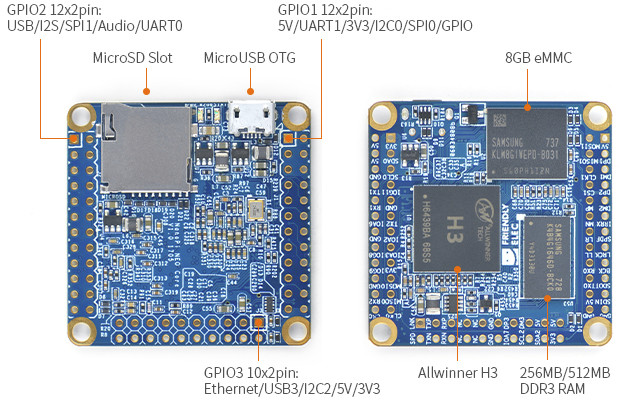
FriendlyELEC has launched many cool NanoPi development boards such as NanoPi NEO2, NanoPi A64, or more recently NanoPi Duo based on Allwinner H- or A- series ARM processors, as well as some models based on Samsung/Nexcell or Amlogic SoC. The company has now launched two other NanoPi products that are a bit different since they are systems-on-module – or could even be considered minimal development boards – with namely NanoPi NEO Core powered by Allwinner H3 quad core 32-bit processor, and NanoPi NEO Core2 based on Allwinner H5 quad core 64-but processor. NanoPi NEO Core Specifications: SoC – Allwinner H3 quad core ARM Cortex-A7 processor up to 1.2GHz with Mali-400MP GPU System Memory – 256MB or 512MB DDR3 RAM Storage – NC/8GB/16GB/32GB eMMC flash, micro SD slot USB – 1x micro USB OTG port also used for power input Expansion – 2x 2.54mm pitch 24-pin headers, 1x 2.54mm pitch 20-pin […]
Azulle Byte3 Mini PC Review – Windows 10, Linux Support, Benchmarks, and Video Playback
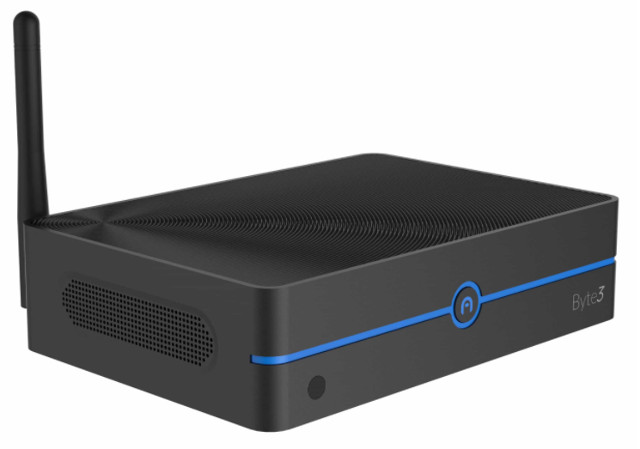
The Azulle Byte3 is a fanless Apollo Lake device featuring both M.2 slot and a SATA connector, as well as supporting HDMI and VGA. It includes USB (both 2.0 and 3.0 including a Type-C port) as well as Gigabit Ethernet: It features an Apollo Lake N3450 SoC and comes with 32GB of storage plus an option of either 4GB or 8GB of RAM and a further option of either with or without Windows 10 Pro meaning Linux users can save around USD 20. Azulle provided me with a device for review and it came in a presentation box complete with a power adapter, and remote control together with a quick guide pamphlet. Whilst the power adapter includes an interchangeable plug it only came with one suitable for the US. Looking at the detail specifications: it is important to realize that the Type-C USB is USB 3.0 which […]
Top 5 Most Powerful Arm SBCs & Development Boards in 2017 / Early 2018
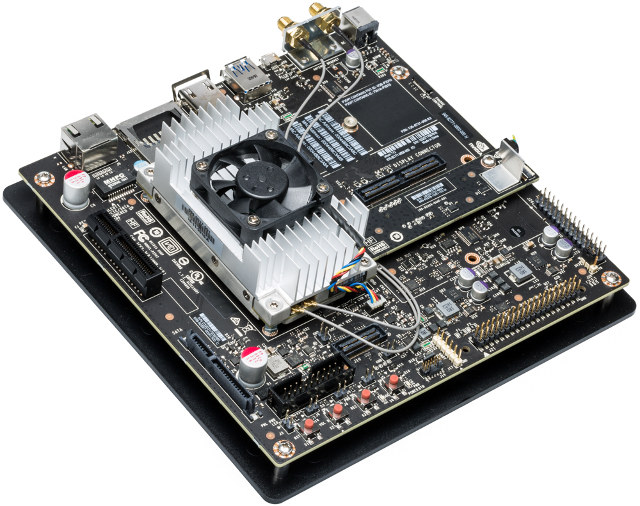
Raspberry Pi, Orange Pi, and NanoPi boards among others are all great and inexpensive Arm Linux development boards that do good enough job for many tasks, but they may not cut it if you have higher requirements either in terms of CPU power, GPU capabilities and performance, I/O bandwidth, and in some cases software and support. So I’ve decided to make a list of 5 single board computers or development boards that I consider to be the most powerful in 2017, early 2018. I have limited the price to $1,000 maximum, the board must be easy to purchase for most people (e.g. you don’t need to be a tier-1 automotive supplier, or operate your own datacenter), and in case the board is not quite available yet, the likeliness of actual launch must be reasonably high. Those criteria for example exclude Intrinsyc Open-Q 835 development kit since it costs $1.149 and […]
AWS DeepLens is a $249 Deep Learning Video Camera for Developers
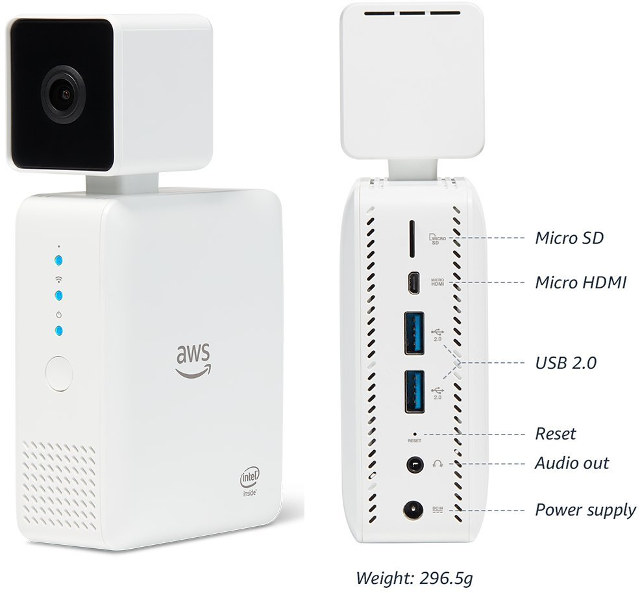
Amazon Web Services (AWS) has launched Deeplens, the “world’s first deep learning enabled video camera for developers”. Powered by an Intel Atom X5 processor with 8GB, and featuring a 4MP (1080p) camera, the fully programmable system runs Ubuntu 16.04, and is designed expand deep learning skills of developers, with Amazon providing tutorials, code, and pre-trained models. AWS Deeplens specifications: SoC – Intel Atom X5 Processor with Intel Gen9 HD graphics (106 GFLOPS of compute power) System Memory – 8GB RAM Storage – 16GB eMMC flash, micro SD slot Camera – 4MP (1080p) camera using MJPEG, H.264 encoding Video Output – micro HDMI port Audio – 3.5mm audio jack, and HDMI audio Connectivity – Dual band WiFi USB – 2x USB 2.0 ports Misc – Power button; camera, WiFi and power status LEDs; reset pinhole Power Supply – TBD Dimensions – 168 x 94 x 47 mm Weight – 296.5 grams The […]
Armbian v5.35 Released with Linux 4.13, U-boot v2017.09, New Boards Support
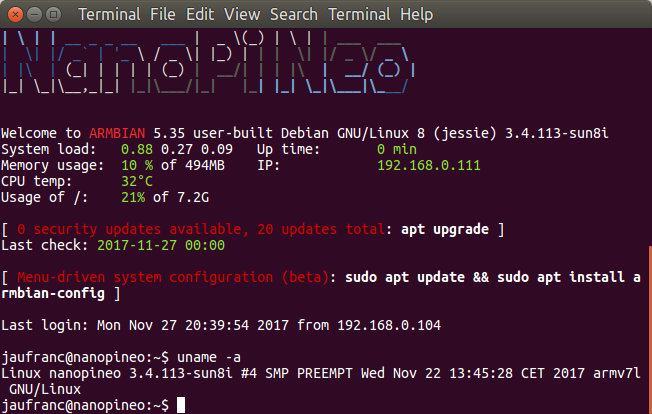
Armbian v5.35 has been released last Friday as a major update that brings Linux mainline kernel to version 4.13, U-Boot mainline to version v2017.09, adds support for 7″ Raspberry Pi display, Realtek WiFi drivers (mainline), and new stable hardware support for NanoPi Duo, Pinebook, and Orange Pi R1. Some other boards got experimental support, including Le Potato, NanoPi NEO 2, Orange Pi Zero Plus, Orange Pi Zero Plus 2 (H5). The desktop version of the images gets a full featured XFCE terminal, OpenVPN connector, a new wallpaper, and various other changes and fixes. armbian-config is normally used to configure the board for example networking configuration, but the utility has become even more useful with support for Hotspot, Bluetooth, SSH server configuration, swtich between stable & beta builds and between kernel applications, adds the ability to start an RDP server, and install third party software such as SAMBA, OpenMediaVault, PiHole, Transmission […]
ECS LIVA Q Could Be The World’s Smallest 4K mini PC
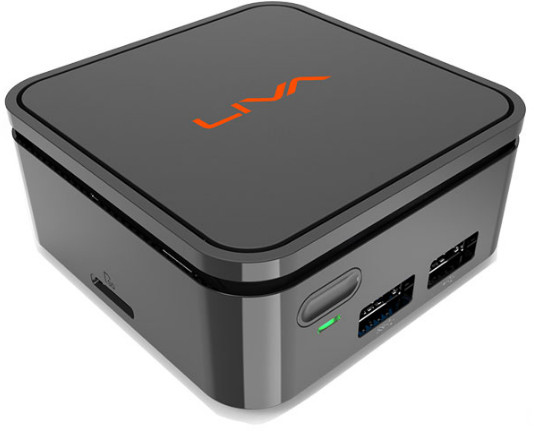
Taiwan based ECS announced several Apollo Lake mini PCs in the past such as Liva Z /ZE based on Intel Celeron N3350/N3450 or Pentium N4200 processor. The company has now launched a new Apollo Lake model. LIVE Q is powered by either Intel Pentium N4200 quad core processor, or Intel Celeron N3350 dual core processor, fitted with 2 to 4GB RAM, and the company claims it’s the world’s smallest “4K pocket computer”. ECS LIVA Q specifications: SoC Intel Apollo Lake Pentium N4200 quad core processor @ 1.1 / 2.5 GHz with 18EU Intel HD graphics; 6W TDP Intel Apollo Lake Celeron N3350 dual core processor @ 1.1 / 2.4 GHz with 12EU Intel HD graphics; 6W TDP Memory – 2GB/4GB LPDDR4 Storage – 32 or 64GB eMMC flash, micro SD slot up to 128GB Video Output – HDMI 2.0 up to 4K @ 60 Hz Connectivity – Gigabit Ethernet, Intel […]
Rockchip RK3399 Sapphire Board is Sold for $75 (Promo)
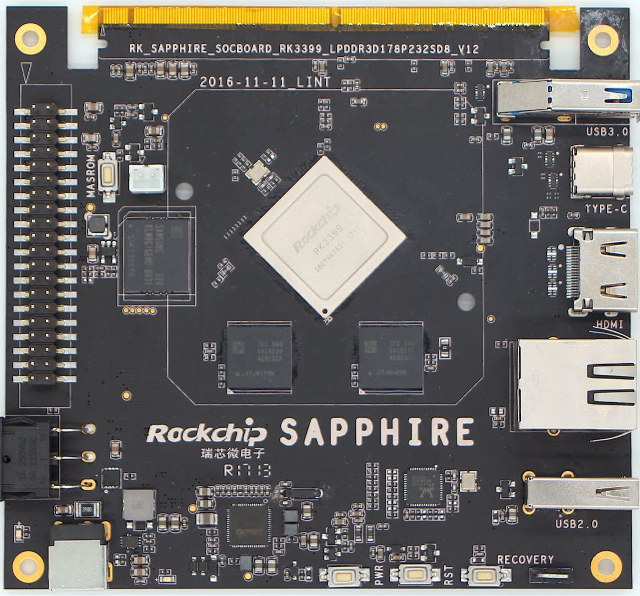
Black Friday is coming soon, so we’ll start to see more an more interesting deals in the day ahead. Last summer, I wrote about what should be the cheapest RK3399 development board: Sapphire, Rockchip’s own evaluation board that sold for $75… on Taobao with limited availability. So not exactly the easiest board to get. But today, I’ve learned that Varms, the company behind ROCK960 board, was selling Sapphire board for the same $75, plus shipping ($20 when I tried) with “many boards in stock”. Just a quick reminder about the specifications: SoC – Rockchip RK3399 hexa-core big.LITTLE processor with two ARM Cortex A72 cores, four Cortex A53 cores, and an ARM Mali-T860 MP4 GPU System Memory – 4 GB LPDDR3, dual channel Storage – 8 GB eMMC flash, micro SD card Video Output / Display Interfaces – 1x HDMI 2.0 up to 4K @ 60 Hz; MIPI DSI, eDP, LVDS via MXM […]


