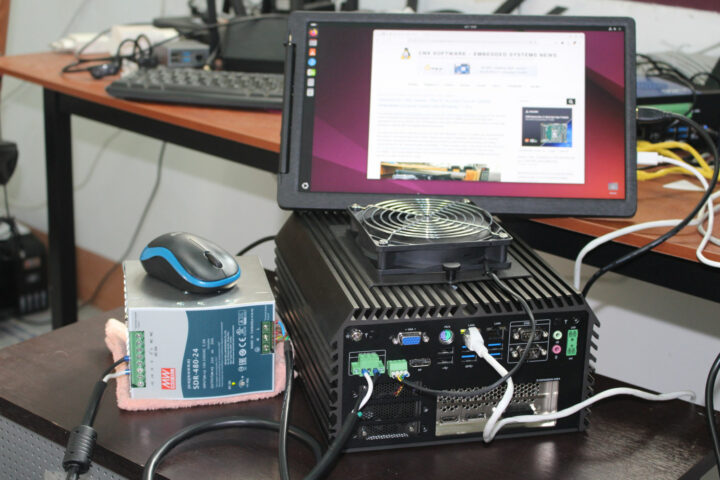
In part one of the Cincoze DS-1402 review, I checked out the hardware of the modular rugged computer before testing the Intel Core i9-12900E embedded computer with Windows 11 Pro in the second part, and I’ve now had time to test the Cincoze DS-1402 embedded system with Ubuntu 24.04.
I’ve tested most features in Linux, ran some benchmarks, evaluated the gigabit Ethernet performance of some of the ten Ethernet ports, checked CPU temperature under a stress test with and without the fan, measured power consumption, and more.
Ubuntu 24.04 system information
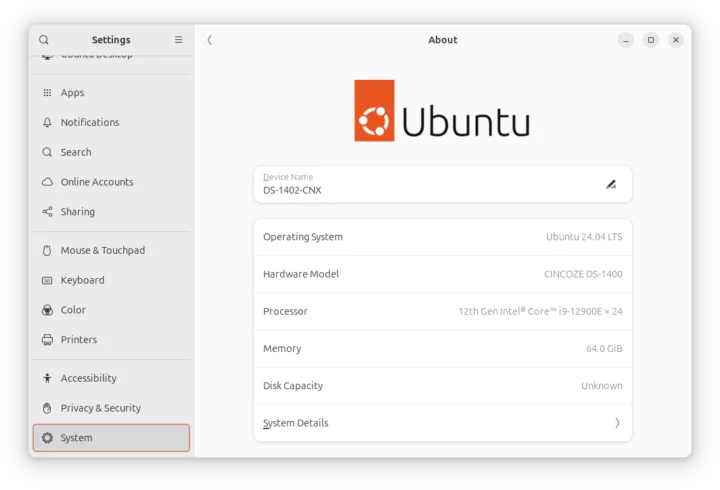
I installed Ubuntu 24.04 with the official x86_64 ISO in dual boot configuration with Windows 11 Pro. The installation process was smooth, and I have nothing specific to report here. Going to the Settings->About window confirms we have a CINCOZE-DS-1400 system (DS-1402 is part of the DS-1400 family) with a 24-thread 12th Gen Intel Core i9-12900E processor and 64GB RAM running Ubuntu 24.04 LTS. Somehow the SSD was not detected.
 We can get some extra information in the command line:
|
1 2 3 4 5 6 7 8 9 10 11 12 13 14 15 16 17 18 19 20 21 |
jaufranc@DS-1402-CNX:~$ cat /etc/lsb-release DISTRIB_ID=Ubuntu DISTRIB_RELEASE=24.04 DISTRIB_CODENAME=noble DISTRIB_DESCRIPTION="Ubuntu 24.04 LTS" jaufranc@DS-1402-CNX:~$ uname -a Linux DS-1402-CNX 6.8.0-36-generic #36-Ubuntu SMP PREEMPT_DYNAMIC Mon Jun 10 10:49:14 UTC 2024 x86_64 x86_64 x86_64 GNU/Linux jaufranc@DS-1402-CNX:~$ free -mh total used free shared buff/cache available Mem: 62Gi 1.5Gi 60Gi 101Mi 1.0Gi 61Gi Swap: 8.0Gi 0B 8.0Gi jaufranc@DS-1402-CNX:~$ df -h Filesystem Size Used Avail Use% Mounted on tmpfs 6.3G 2.4M 6.3G 1% /run /dev/nvme0n1p5 300G 237G 48G 84% / tmpfs 32G 0 32G 0% /dev/shm tmpfs 5.0M 12K 5.0M 1% /run/lock efivarfs 192K 123K 65K 66% /sys/firmware/efi/efivars /dev/nvme0n1p1 96M 34M 63M 35% /boot/efi tmpfs 6.3G 96K 6.3G 1% /run/user/120 tmpfs 6.3G 84K 6.3G 1% /run/user/1000 |
The SSD has a capacity of 512GB but I resized the Windows partition to have 300GB for Ubuntu 24.04 since I needed at least 200GB free to regenerated the Llama 3 model when I reviewed the Radxa Fogwise Airbox.
inxi utility provides further details:
|
1 2 3 4 5 6 7 8 9 10 11 12 13 14 15 16 17 18 19 20 21 22 23 24 25 26 27 28 29 30 31 32 33 34 35 36 37 38 39 40 41 42 43 44 45 46 47 48 49 50 51 52 53 54 55 56 57 58 59 60 61 62 63 64 65 66 67 |
jaufranc@DS-1402-CNX:~$ sudo inxi -Fc0 System: Host: DS-1402-CNX Kernel: 6.8.0-36-generic arch: x86_64 bits: 64 Console: pty pts/1 Distro: Ubuntu 24.04 LTS (Noble Numbat) Machine: Type: Desktop Mobo: CINCOZE model: DS-1400 v: 1.0.00.001 serial: N/A UEFI: American Megatrends LLC. v: 5.27 date: 01/26/2024 CPU: Info: 16-core (8-mt/8-st) model: 12th Gen Intel Core i9-12900E bits: 64 type: MST AMCP cache: L2: 14 MiB Speed (MHz): avg: 820 min/max: 800/5000:3800 cores: 1: 800 2: 800 3: 800 4: 800 5: 800 6: 800 7: 800 8: 800 9: 800 10: 800 11: 800 12: 800 13: 800 14: 800 15: 800 16: 800 17: 800 18: 800 19: 800 20: 1300 21: 800 22: 800 23: 800 24: 800 Graphics: Device-1: Intel AlderLake-S GT1 driver: i915 v: kernel Device-2: NVIDIA TU117 [GeForce GTX 1630] driver: nvidia v: 535.183.01 Display: server: X.org v: 1.21.1.11 with: Xwayland v: 23.2.6 driver: X: loaded: modesetting,nvidia unloaded: fbdev,nouveau,vesa dri: iris gpu: i915 tty: 80x24 resolution: 1920x1080 API: EGL Message: No EGL data available. API: OpenGL Message: GL data unavailable in console for root. Audio: Device-1: Intel Alder Lake-S HD Audio driver: snd_hda_intel Device-2: NVIDIA driver: snd_hda_intel API: ALSA v: k6.8.0-36-generic status: kernel-api Network: Device-1: Intel Ethernet I219-LM driver: e1000e IF: eno1 state: down mac: 2c:94:64:08:83:02 Device-2: Intel I210 Gigabit Network driver: igb IF: enp5s0 state: down mac: 2c:94:64:07:3f:32 Device-3: Intel I210 Gigabit Network driver: igb IF: enp6s0 state: down mac: 2c:94:64:07:3f:33 Device-4: Intel I210 Gigabit Network driver: igb IF: enp9s0 state: down mac: 2c:94:64:07:3f:34 Device-5: Intel I210 Gigabit Network driver: igb Device-6: Intel I210 Gigabit Network driver: igb Device-7: Intel I210 Gigabit Network driver: igb Device-8: Intel I210 Gigabit Network driver: igb Device-9: Intel I210 Gigabit Network driver: igb Device-10: Intel I210 Gigabit Network driver: igb IF-ID-1: docker0 state: down mac: 02:42:b3:1d:0e:37 IF-ID-2: enp10s0 state: down mac: 2c:94:64:07:3f:35 IF-ID-3: enp11s0 state: down mac: 2c:94:64:08:83:03 IF-ID-4: enp14s0 state: up speed: 1000 Mbps duplex: full mac: 2c:94:64:07:3f:62 IF-ID-5: enp15s0 state: down mac: 2c:94:64:07:3f:63 IF-ID-6: enp18s0 state: down mac: 2c:94:64:07:3f:64 IF-ID-7: enp19s0 state: down mac: 2c:94:64:07:3f:65 Drives: Local Storage: total: 476.94 GiB used: 236.39 GiB (49.6%) ID-1: /dev/nvme0n1 model: CIE M8 T435 512GB size: 476.94 GiB Partition: ID-1: / size: 299.43 GiB used: 236.35 GiB (78.9%) fs: ext4 dev: /dev/nvme0n1p5 ID-2: /boot/efi size: 96 MiB used: 33.4 MiB (34.8%) fs: vfat dev: /dev/nvme0n1p1 Swap: ID-1: swap-1 type: file size: 8 GiB used: 0 KiB (0.0%) file: /swap.img Sensors: System Temperatures: cpu: 33.0 C mobo: N/A gpu: nvidia temp: 39 C Fan Speeds (rpm): N/A Info: Memory: total: 64 GiB available: 62.57 GiB used: 1.66 GiB (2.7%) igpu: 60 MiB Processes: 423 Uptime: 2m Init: systemd target: graphical (5) Shell: Sudo inxi: 3.3.34 |
The Intel Core i9-12900E CPU P-cores are designed to work between 800 MHz and 5,000 MHz, and the E-Cores between 800 MHz and 3,800 MHz. Both the iGPU (Intel AlderLake-S GT1) and graphics card (NVIDIA TU117 – GeForce GTX 1630) are detected, as well as all 10 gigabit Ethernet ports (1x I219-LM and 9x I210) and the 512GB Cervoz CIE M8 T435 industrial-grade SSD. The idle CPU temperature is reported to be 33°C at idle and the NVIDIA GPU temperature is 39°C.
Cincoze DS-1402 benchmarks on Ubuntu 24.04
We’ll start benchmarking the Cincose DS-1402 (Core i9-12900E) with Thomas Kaiser’s sbc-bench.sh:
|
1 2 3 4 5 6 7 8 9 10 11 12 13 14 15 16 17 18 19 20 21 22 23 24 25 26 27 28 29 30 31 32 33 34 35 36 37 38 39 40 41 42 43 44 45 46 47 48 49 50 51 52 53 54 55 56 57 58 59 60 61 62 63 64 65 66 67 68 69 70 71 72 73 74 75 76 77 78 79 80 81 82 83 84 85 86 87 88 89 90 91 92 93 94 95 96 97 98 99 100 101 102 103 104 105 106 107 108 109 110 111 112 113 114 115 116 117 118 119 120 121 122 123 124 125 126 127 128 129 130 131 132 133 134 135 136 137 138 139 140 141 142 143 144 145 146 147 148 149 150 151 152 153 154 155 |
jaufranc@DS-1402-CNX:~$ sudo ./sbc-bench.sh -r Starting to examine hardware/software for review purposes... sbc-bench v0.9.67 Installing needed tools: apt-get -f -qq -y install powercap-utils links mmc-utils smartmontools stress-ng, p7zip 16.02, tinymembench, ramlat, mhz, cpufetch, cpuminer. Done. Checking cpufreq OPP. Done. Executing tinymembench. Done. Executing RAM latency tester. Done. Executing OpenSSL benchmark. Done. Executing 7-zip benchmark. Done. Throttling test: heating up the device, 5 more minutes to wait. Done. Checking cpufreq OPP again. Done (14 minutes elapsed). Results validation: * Measured clockspeed not lower than advertised max CPU clockspeed * No swapping * Background activity (%system) OK * Powercap detected. Details: "sudo powercap-info -p intel-rapl" -> https://tinyurl.com/4jh9nevj Full results uploaded to https://0x0.st/XBAr.bin # CINCOZE DS-1400 1.0.00.001 / i9-12900E Tested with sbc-bench v0.9.67 on Sat, 06 Jul 2024 11:30:15 +0700. Full info: [https://0x0.st/XBAr.bin](http://0x0.st/XBAr.bin) ### General information: Information courtesy of cpufetch: Name: 12th Gen Intel(R) Core(TM) i9-12900E Microarchitecture: Alder Lake Technology: 10nm P-cores: Max Frequency: 5.000 GHz Cores: 8 cores (16 threads) AVX: AVX,AVX2 FMA: FMA3 L1i Size: 32KB (256KB Total) L1d Size: 48KB (384KB Total) L2 Size: 1.25MB (10MB Total) E-cores: Max Frequency: 3.800 GHz Cores: 8 cores AVX: AVX,AVX2 FMA: FMA3 L1i Size: 64KB (512KB Total) L1d Size: 32KB (256KB Total) L2 Size: 2MB (4MB Total) L3 Size: 30MB The CPU features 2 clusters of different core types: i9-12900E, Kernel: x86_64, Userland: amd64 CPU sysfs topology (clusters, cpufreq members, clockspeeds) cpufreq min max CPU cluster policy speed speed core type 0 0 0 800 5000 Golden Cove 1 0 1 800 5000 Golden Cove 2 0 2 800 5000 Golden Cove 3 0 3 800 5000 Golden Cove 4 0 4 800 5000 Golden Cove 5 0 5 800 5000 Golden Cove 6 0 6 800 5000 Golden Cove 7 0 7 800 5000 Golden Cove 8 0 8 800 5000 Golden Cove 9 0 9 800 5000 Golden Cove 10 0 10 800 5000 Golden Cove 11 0 11 800 5000 Golden Cove 12 0 12 800 5000 Golden Cove 13 0 13 800 5000 Golden Cove 14 0 14 800 5000 Golden Cove 15 0 15 800 5000 Golden Cove 16 0 16 800 3800 Gracemont 17 0 17 800 3800 Gracemont 18 0 18 800 3800 Gracemont 19 0 19 800 3800 Gracemont 20 0 20 800 3800 Gracemont 21 0 21 800 3800 Gracemont 22 0 22 800 3800 Gracemont 23 0 23 800 3800 Gracemont 64066 KB available RAM ### Policies (performance vs. idle consumption): Status of performance related policies found below /sys: /sys/module/pcie_aspm/parameters/policy: [default] performance powersave powersupersave ### Clockspeeds (idle vs. heated up): Before at 37.0°C: cpu0-cpu15 (Golden Cove): OPP: 5000, Measured: 4983 cpu16-cpu23 (Gracemont): OPP: 3800, Measured: 3784 After at 48.0°C: cpu0-cpu15 (Golden Cove): OPP: 5000, Measured: 4983 cpu16-cpu23 (Gracemont): OPP: 3800, Measured: 3784 ### Performance baseline * cpu0 (Golden Cove): memcpy: 28908.2 MB/s, memchr: 46988.3 MB/s, memset: 38884.4 MB/s * cpu16 (Gracemont): memcpy: 9525.8 MB/s, memchr: 21837.1 MB/s, memset: 17444.9 MB/s * cpu0 (Golden Cove) 16M latency: 17.99 16.68 17.48 16.82 17.25 16.54 16.71 17.69 * cpu16 (Gracemont) 16M latency: 26.80 25.32 27.10 25.59 26.57 25.14 25.64 28.62 * cpu0 (Golden Cove) 128M latency: 81.21 74.15 79.81 74.98 82.01 66.00 69.05 66.32 * cpu16 (Gracemont) 128M latency: 114.4 109.8 114.7 110.2 114.3 105.0 105.8 107.1 * 7-zip MIPS (3 consecutive runs): 50586, 42634, 42664 (45290 avg), single-threaded: 6389 * `aes-256-cbc 1539954.86k 1733243.52k 1761603.07k 1769276.42k 1770870.10k 1771530.92k (Golden Cove)` * `aes-256-cbc 1009140.29k 1308895.19k 1256574.21k 1344221.18k 1372050.77k 1373558.10k (Gracemont)` ### PCIe and storage devices: * Intel I210 Gigabit Network Connection: Speed 2.5GT/s, Width x1, driver in use: igb, ASPM Disabled * Intel I210 Gigabit Network Connection: Speed 2.5GT/s, Width x1, driver in use: igb, ASPM Disabled * Intel I210 Gigabit Network Connection: Speed 2.5GT/s, Width x1, driver in use: igb, ASPM Disabled * Intel I210 Gigabit Network Connection: Speed 2.5GT/s, Width x1, driver in use: igb, ASPM Disabled * Intel I210 Gigabit Network Connection: Speed 2.5GT/s, Width x1, driver in use: igb, ASPM Disabled * Intel I210 Gigabit Network Connection: Speed 2.5GT/s, Width x1, driver in use: igb, ASPM Disabled * Intel I210 Gigabit Network Connection: Speed 2.5GT/s, Width x1, driver in use: igb, ASPM Disabled * Intel I210 Gigabit Network Connection: Speed 2.5GT/s, Width x1, driver in use: igb, ASPM Disabled * Intel I210 Gigabit Network Connection: Speed 2.5GT/s, Width x1, driver in use: igb, ASPM Disabled * 476.9GB "CIE M8 T435 512GB" SSD as /dev/nvme0: Speed 8GT/s, Width x4, 0% worn out, drive temp: 35°C, ASPM Disabled * Winbond W25Q256 32MB SPI NOR flash, drivers in use: spi-nor/intel-spi ### Challenging filesystems: The following partitions are NTFS: nvme0n1p3,nvme0n1p4 -> https://tinyurl.com/mv7wvzct ### Swap configuration: * /swap.img on /dev/nvme0n1p5: 8.0G (0K used) ### Software versions: * Ubuntu 24.04 LTS (noble) * Compiler: /usr/bin/gcc (Ubuntu 13.2.0-23ubuntu4) 13.2.0 / x86_64-linux-gnu * OpenSSL 3.0.13, built on 30 Jan 2024 (Library: OpenSSL 3.0.13 30 Jan 2024) ### Kernel info: * `/proc/cmdline: BOOT_IMAGE=/boot/vmlinuz-6.8.0-36-generic root=UUID=9bddb81a-b7b5-4fc9-8141-4b30ffb261a1 ro quiet splash vt.handoff=7` * Vulnerability Reg file data sampling: Mitigation; Clear Register File * Vulnerability Spec store bypass: Mitigation; Speculative Store Bypass disabled via prctl * Vulnerability Spectre v1: Mitigation; usercopy/swapgs barriers and __user pointer sanitization * Vulnerability Spectre v2: Mitigation; Enhanced / Automatic IBRS; IBPB conditional; RSB filling; PBRSB-eIBRS SW sequence; BHI BHI_DIS_S * Kernel 6.8.0-36-generic / CONFIG_HZ=1000 Waiting for the device to cool down...................................... 38.0°C |
We’ll do a comparison later, but we can already see the power limits in action with the 7-zip test starting at 50,586 MIPS for the first run, before dropping to 42,634 and 42,664 MIPS in the second and third runs respectively. I can also notice that the I219-LM Ethernet interface is missing from the list of PCIe devices.
Let’s check the PL1 and PL2 power limits as requested:
|
1 2 3 4 5 6 7 8 9 10 11 12 13 14 15 16 17 18 19 20 21 22 23 24 25 26 27 28 29 30 31 32 33 34 35 36 37 38 39 |
jaufranc@DS-1402-CNX:~$ sudo powercap-info -p intel-rapl enabled: 1 Zone 0 name: package-0 enabled: 1 max_energy_range_uj: 262143328850 energy_uj: 62789273280 Constraint 0 name: long_term power_limit_uw: 65000000 time_window_us: 27983872 max_power_uw: 65000000 Constraint 1 name: short_term power_limit_uw: 202000000 time_window_us: 2440 max_power_uw: 0 Constraint 2 name: peak_power power_limit_uw: 311000000 max_power_uw: 0 Zone 0:0 name: core enabled: 0 max_energy_range_uj: 262143328850 energy_uj: 37217849424 Constraint 0 name: long_term power_limit_uw: 0 time_window_us: 976 Zone 0:1 name: uncore enabled: 0 max_energy_range_uj: 262143328850 energy_uj: 1103695 Constraint 0 name: long_term power_limit_uw: 0 time_window_us: 976 |
PL1 is set to 65W and PL2 to 202W in Ubuntu 24.04, or exactly the same values as in Windows 11.
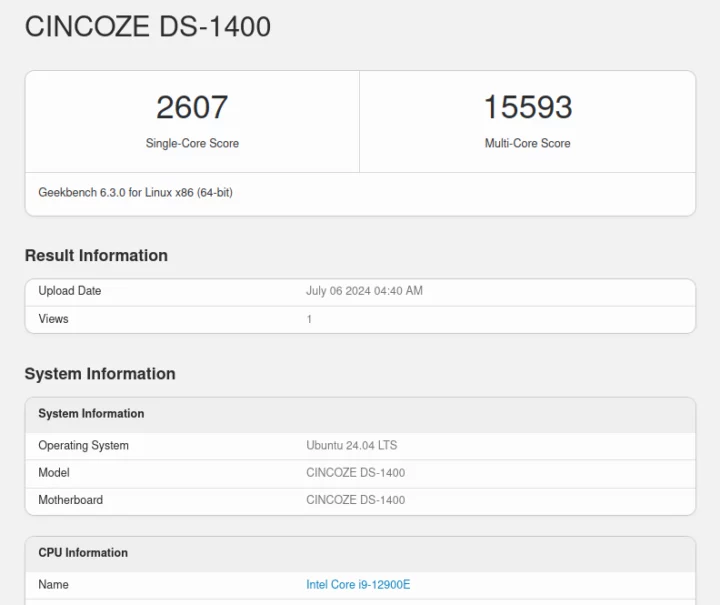
Geekbench 6.3.0 will be used to test the single-core and multi-core CPU performance of the Core i9-12900E processor.
The Cincoze DS-1402 achieved 2,607 points in the single-core test, and 15,593 points in the multi-core test.
Let’s now test the GPUs with the Unigine Heaven Benchmark v4.0. The first time, I used the HDMI port on the front panel, and the system with an Intel Core i9-12900E processor and an Unknown GPU rendered the scene at 25.1 FPS on average with a score of 633 points at the standard 1920×1080 resolution.
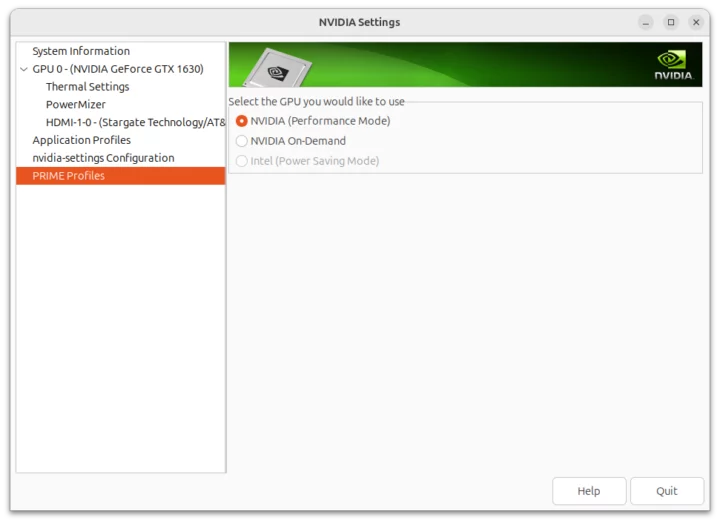
That’s quite a low score and it’s likely the internal 32EU Intel UHD Graphics 770 GPU was used for this test. So I changed the settings in NVIDIA Settings->PRIME Profiles from “NVIDIA On-Demand” to “NVIDIA (Performance Mode)” and rebooted the system as requested.
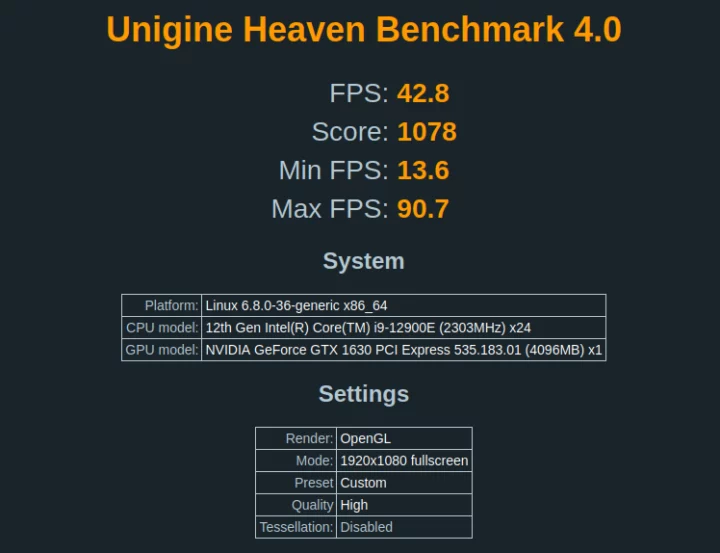
I also moved the HDMI cable to the HDMI port on the NVIDIA GTX 1630 graphics card, but that part did not matter since switching back to the front panel’s HDMI port and repeating the test yielded about the same results. In any case, now that the NVIDIA GTX 1630 entry-level graphics card was used the Unigine Heaven Benchmark 4.0 could be rendered at 42.8 FPS on average with a score of 1,078 points.
For reference, the computer averaged 48.3 FPS and achieved 1,218 points at 1920×1080 resolution in Windows 11 using Direct3D11 instead of OpenGL.
Next up was YouTube 4K and 8K video playback using Firefox while connected to the HDMI port on the front panel.
I went straight to 8K 60FPS and it was a complete disaster with a massive amount of dropped frames (1,930 frames dropped out of 2,550) and I only had a still image after a few seconds.
But after changing the video resolution to 2160p60 (4K 60 FPS), it played just fine with only a few frames dropped over a 7-minute period.
I tried another 8K video at 30 FPS, and it played fine for 7 minutes with 31 frames dropped out of 12.663 points. I installed Google Chrome browser to see what would happen at 8K 60 FPS.
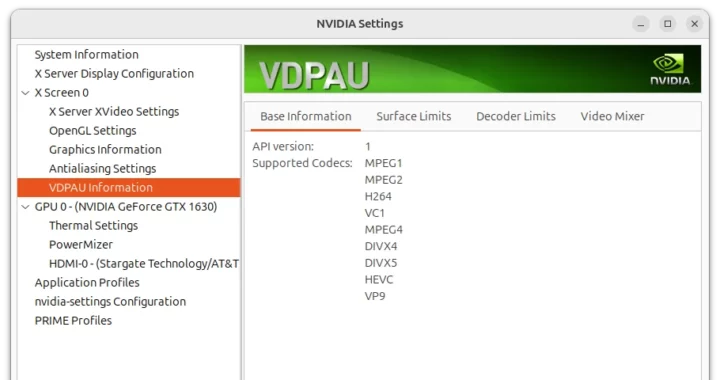
It almost started fine for the first few seconds, but it quickly ended up being more or less the same as in Firefox with a massive number of dropped frames and the loading icon showing from time to time despite the buffer health doing OK. So I went to NVIDIA Settings again, and VDPAU does not list AV1 as a supported codec.
At that point, I thought maybe that must be the reason why. But in a plot twist, I turned off the computer before going to bed, then turned it on again in the morning and started playing the same 8K 60 FPS video in Firefox, and that time around the video played close to perfectly with only 104 frames dropped out of 37,102.
I also checked CPU usage with the htop utility and the load was only 6 on a 24-thread system. It’s still using the AV1 codec, so I’m not exactly sure what happened before.
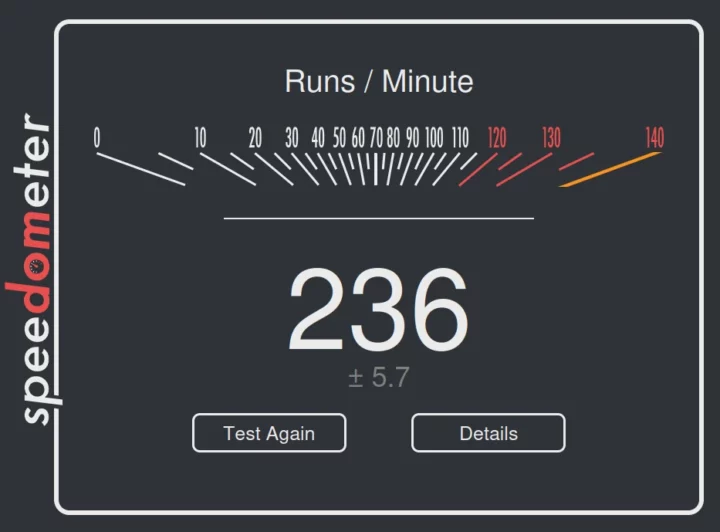
Finally, I tested web browser performance with Speedometer 2.0 with the latest version of Firefox.
The result was 236 runs per minute. It’s a bit lower than some on other Intel Core i9 or AMD Ryzen 9 I tested recently, so I repeated the test a few times, and each time it was 236 or 237. Maybe that’s because the Core i9-12900E is a 12th Gen CPU.
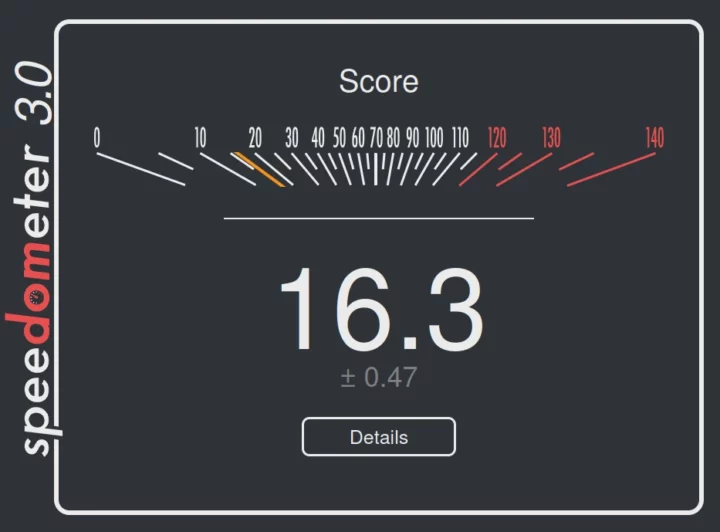
Since Speedometer 2.0 is deprecated, I also ran the newer Speedometer 3.0 to get data for future reviews, and the Cincoze DS-1402 achieved 16.3 points in the new benchmark.
Comparison of Cincoze DS-1402 benchmarks against mini PCs running Ubuntu 24.04/22.04
Time to compare the Ubuntu 24.04 benchmarks results for the Cincoze DS-1402 (Core i9-12900E) embedded computer against high-end consumer-grade mini PCs namely the GEEKOM XT12 Pro (Intel Core i9-12900H) and GEEKOM Mini IT13 (Intel Core i9-13900H), and GEEKOM A8 (AMD Ryzen 9 8945HS) running Ubuntu 22.04 or 24.04.
The table below shows the basic specifications of each system
| Cincoze DS-1402 | GEEKOM XT12 Pro | GEEKOM IT13 | GEEKOM A8 | |
|---|---|---|---|---|
| SoC | Intel Core i9-12900E | Intel Core i9-12900H | Intel Core i9-13900H | AMD Ryzen 9 8945HS |
| CPU | 16-core/24-thread (8P+8E) Alder Lake processor up to 5.00 GHz (P-cores), up to 3.80 GHz (E-Cores) | 14-core/20-thread (6P+8E) Alder Lake processor up to 5.00 GHz (P-cores), up to 3.80 GHz (E-Cores) | 14-core/20-thread (6P+8E) Raptor Lake processor up to 5.40 GHz (P-cores), up to 4.10 GHz (E-Cores) | 8-core/16-thread processor up to 5.2 GHz |
| GPU | 32EU Intel UHD Graphics 770 NVIDIA GTX 1630 graphics card | 96EU Intel Iris Xe Graphics | 96 EU Intel Iris Xe Graphics | AMD Radeon 780M Graphics |
| Memory | 64GB DDR5-4800 | 32GB DDR4-3200 | 32GB DDR4-3200 | 32GB DDR5-5600 |
| Storage | 512GB NVMe SSD | 1TB NVMe SSD | 2TB NVMe SSD | 2TB NVMe SSD |
| Default OS | Windows 11 Pro | Windows 11 Pro | Windows 11 Pro | Windows 11 Pro |
Here is the Ubuntu/Linux benchmarks comparison table.
| Cincoze DS-1402 | GEEKOM XT12 Pro | GEEKOM Mini IT13 | GEEKOM A8 | |
|---|---|---|---|---|
| sbc-bench.sh | ||||
| - memcpy | 28,908.2 (P-Cores) | 22,375.8MB/s | 24,014.4 MB/s (P-core) | 20,318.5 |
| - memset | 38,884.4 (P-cores) | 27,398.0MB/s | 26,647.9 MB/s (P-Core) | 62,156.7 |
| - 7-zip (average) | 45,290 | 40,190 | 56,540 | 68,790 |
| - 7-zip (top result) | 50,586 | 43,783 | 60,981 | 69,297 |
| - OpenSSL AES-256 16K | 1,771,530.92k (P-Core) | 1,661,583.36k (P-Core) | 1,844,401.49k (P-Core) | 1,422,136.66k |
| Geekbench 6 Single | 2,607 | 2,575 | 2,745 | 2,661 |
| Geekbench 6 Multi | 15,593 | 10,447 | 11,974 | 13,275 |
| Unigine Heaven score | 633 (iGPU) 1,079 (NVIDIA GTX 1630) | 1,293 | 1,333 | 1,972 |
| Speedometer 2.0 (Firefox) | 236 | 298 | 273 | 298 |
Unsurprisingly the 24-thread Core i9-12900E processor will perform better than the 20-thread Core i9-12900H in multi-core benchmarks such as 7-zip and GeekBench multi-core. There’s more variability in single-core workloads, as both the DS-1402 and XT12 Pro have a similar GeekBench 6.3 single-core score, but the former is faster for AES-256, and the latter is faster in Speedometer 2.0. The iGPU of the Core i9-12900E is clearly not its strong point, and even the entry-level GTX 1630 graphics card installed in the computer is slower than iGPU of the other Intel and AMD processors tested, with AMD usually performing better.
Storage performance and USB ports
The 512GB NVMe SSD installed in the system was tested with iozone3 utility:
|
1 2 3 4 5 6 7 8 9 10 11 12 13 14 15 |
jaufranc@DS-1402-CNX:~$ sudo iozone -e -I -a -s 1000M -r 4k -r 16k -r 512k -r 1024k -r 16384k -i 0 -i 1 -i 2 Iozone: Performance Test of File I/O Version $Revision: 3.506 $ Compiled for 64 bit mode. Build: linux-AMD64 random random bkwd record stride kB reclen write rewrite read reread read write read rewrite read fwrite frewrite fread freread 1024000 4 266924 311945 376804 377135 74805 306798 1024000 16 694444 794729 946100 940130 143558 784375 1024000 512 1491552 545799 1237042 1239759 932991 809564 1024000 1024 1479846 564709 1328684 1339731 1028973 780648 1024000 16384 762931 454169 1578280 1584919 1543288 508228 iozone test complete. |
I found the lower write speed with 16KB IO requests to be rather odd. So I repeated the test two more times:
|
1 2 3 4 5 6 7 8 9 10 11 12 13 14 15 16 17 |
jaufranc@DS-1402-CNX:~$ sudo iozone -e -I -a -s 1000M -r 4k -r 16k -r 512k -r 1024k -r 16384k -i 0 -i 1 -i 2 random random bkwd record stride kB reclen write rewrite read reread read write read rewrite read fwrite frewrite fread freread 1024000 4 261252 320985 377022 364708 71735 309313 1024000 16 688968 853810 1061710 989378 153991 613545 1024000 512 451438 519561 1195185 1233257 935310 1351153 1024000 1024 582001 448259 1273704 1273872 1002215 443649 1024000 16384 439707 437376 1629195 1614646 1531302 441990 jaufranc@DS-1402-CNX:~$ sudo iozone -e -I -a -s 1000M -r 4k -r 16k -r 512k -r 1024k -r 16384k -i 0 -i 1 -i 2 random random bkwd record stride kB reclen write rewrite read reread read write read rewrite read fwrite frewrite fread freread 1024000 4 280472 310645 375512 376991 78873 284862 1024000 16 691918 744029 937615 926271 141036 453067 1024000 512 462862 984913 1384945 1381977 1036660 1530770 1024000 1024 1503763 1559048 1561306 1560656 1204789 1511470 1024000 16384 515213 902951 1783323 1783655 1783827 1642599 |
Some caching must make 1024 bytes IO requests faster during writes. The fastest read speed was around 1,783 MB/s, and I’m not sure if any of the numbers for the write operations can be used here… For reference, CrystalDiskMark reports a 2,088 MB/s sequential read speed, and a 1715 MB/s sequential write speed in Windows 11. In any case, the Cervoz T435 is an entry-level SSD in terms of performance, but it’s also an industrial-grade SSD module designed to work in the -40°C ~ 85°C temperature range and an MTBF of over 3,000,000 hours.
An EXT-4 partition from a drive in an ORICO M234C3-U4 “USB4” M.2 NVMe SSD enclosure was used to check the speed of each USB 3.0 port along with lsusb and iozone3 command line utilities.
Here’s the output from the front left USB port:
|
1 2 3 4 5 6 7 |
jaufranc@DS-1402-CNX:~$ lsusb -t | grep uas |__ Port 001: Dev 002, If 0, Class=Mass Storage, Driver=uas, 10000M jaufranc@DS-1402-CNX:/media/sda1$ sudo iozone -e -I -a -s 1000M -r 16384k -i 0 -i 1 random random bkwd record stride kB reclen write rewrite read reread read write read rewrite read fwrite frewrite fread freread 1024000 16384 972315 973623 874335 877534 |
and the top left USB 3.0 port on the rear panel:
|
1 2 3 4 5 6 |
jaufranc@DS-1402-CNX:/media/sda1$ lsusb -t | grep uas |__ Port 006: Dev 004, If 0, Class=Mass Storage, Driver=uas, 5000M jaufranc@DS-1402-CNX:/media/sda1$ sudo iozone -e -I -a -s 1000M -r 16384k -i 0 -i 1 random random bkwd record stride kB reclen write rewrite read reread read write read rewrite read fwrite frewrite fread freread 1024000 16384 447750 448403 437329 437450 |
I switched to a USB hard drive for the USB 2.0 ports. See the results for the top left USB 2.0 port on the rear panel:
|
1 2 3 4 5 6 |
jaufranc@DS-1402-CNX:/media/sdb2$ lsusb -t | grep uas |__ Port 012: Dev 004, If 0, Class=Mass Storage, Driver=uas, 480M jaufranc@DS-1402-CNX:/media/sdb2$ sudo iozone -e -I -a -s 100M -r 16384k -i 0 -i 1 random random bkwd record stride kB reclen write rewrite read reread read write read rewrite read fwrite frewrite fread freread 102400 16384 40643 42025 37431 40540 |
Here’s a summary of the results of all eight ports from left to right:
- Front panel
- USB-A #1 – USB 3.2 – 10 Gbps – Read speed: 874 MB/s; write speed: 972 MB/s
- USB-A #2 – USB 3.2 – 10 Gbps – Read speed: 871 MB/s; write speed: 983 MB/s
- Rear panel
- USB-A #1 (top) – USB 2.0 – 480 Mbps – Read speed: 37 MB/s; write speed: 40 MB/s
- USB-A #2 (top) – USB 3.2 – 5 Gbps – Read speed: 437 MB/s; write speed: 447 MB/s
- USB-A #3 (top) – USB 3.2 – 5 Gbps – Read speed: 439 MB/s; write speed: 447 MB/s
- USB-A #4 (bottom) – USB 2.0 – 480 Mbps – Read speed: 38 MB/s; write speed: 41 MB/s
- USB-A #5 (bottom) – USB 3.2 – 5 Gbps – Read speed: 437 MB/s; write speed: 447 MB/s
- USB-A #6 (bottom) – USB 3.2 – 5 Gbps – Read speed: 438 MB/s; write speed: 447 MB/s
All results are as advertised in the specifications.
Gigabit Ethernet ports performance
The Cincoze DS-1402 has ten Gigabit Ethernet ports, two default ports, and eight implemented through two CMI expansion cards with four GbE RJ45 ports each. I won’t test them all and only report the results for the built-in ports, and the left RJ45 jack of each CMI module. I felt confident so I went straight to full-duplex (aka bidirectional) testing.
LAN1 (Intel i219):
|
1 2 3 4 5 6 7 8 9 10 11 12 13 14 15 16 17 18 19 20 21 22 23 24 25 |
devkit@UPX-i11:~$ iperf3 -t 60 -c 192.168.31.46 -i 10 --bidir Connecting to host 192.168.31.46, port 5201 [ 5] local 192.168.31.12 port 54798 connected to 192.168.31.46 port 5201 [ 7] local 192.168.31.12 port 54800 connected to 192.168.31.46 port 5201 [ ID][Role] Interval Transfer Bitrate Retr Cwnd [ 5][TX-C] 0.00-10.00 sec 1.10 GBytes 941 Mbits/sec 0 754 KBytes [ 7][RX-C] 0.00-10.00 sec 1.08 GBytes 924 Mbits/sec [ 5][TX-C] 10.00-20.00 sec 1.09 GBytes 937 Mbits/sec 0 1.13 MBytes [ 7][RX-C] 10.00-20.00 sec 1.08 GBytes 931 Mbits/sec [ 5][TX-C] 20.00-30.00 sec 1.09 GBytes 937 Mbits/sec 0 1.13 MBytes [ 7][RX-C] 20.00-30.00 sec 1.08 GBytes 931 Mbits/sec [ 5][TX-C] 30.00-40.00 sec 1.09 GBytes 938 Mbits/sec 0 1.13 MBytes [ 7][RX-C] 30.00-40.00 sec 1.08 GBytes 931 Mbits/sec [ 5][TX-C] 40.00-50.00 sec 1.09 GBytes 937 Mbits/sec 0 1.13 MBytes [ 7][RX-C] 40.00-50.00 sec 1.08 GBytes 931 Mbits/sec [ 5][TX-C] 50.00-60.00 sec 1.09 GBytes 938 Mbits/sec 0 1.13 MBytes [ 7][RX-C] 50.00-60.00 sec 1.08 GBytes 931 Mbits/sec - - - - - - - - - - - - - - - - - - - - - - - - - [ ID][Role] Interval Transfer Bitrate Retr [ 5][TX-C] 0.00-60.00 sec 6.55 GBytes 938 Mbits/sec 0 sender [ 5][TX-C] 0.00-60.00 sec 6.55 GBytes 938 Mbits/sec receiver [ 7][RX-C] 0.00-60.00 sec 6.50 GBytes 931 Mbits/sec 160 sender [ 7][RX-C] 0.00-60.00 sec 6.50 GBytes 930 Mbits/sec receiver iperf Done. |
LAN2 (Intel i210):
|
1 2 3 4 5 6 7 8 9 10 11 12 13 14 15 16 17 18 19 20 21 22 23 24 25 |
devkit@UPX-i11:~$ iperf3 -t 60 -c 192.168.31.47 -i 10 --bidir Connecting to host 192.168.31.47, port 5201 [ 5] local 192.168.31.12 port 33316 connected to 192.168.31.47 port 5201 [ 7] local 192.168.31.12 port 33326 connected to 192.168.31.47 port 5201 [ ID][Role] Interval Transfer Bitrate Retr Cwnd [ 5][TX-C] 0.00-10.00 sec 1.09 GBytes 940 Mbits/sec 0 567 KBytes [ 7][RX-C] 0.00-10.00 sec 1.09 GBytes 937 Mbits/sec [ 5][TX-C] 10.00-20.00 sec 1.09 GBytes 938 Mbits/sec 0 738 KBytes [ 7][RX-C] 10.00-20.00 sec 1.09 GBytes 937 Mbits/sec [ 5][TX-C] 20.00-30.00 sec 1.09 GBytes 938 Mbits/sec 0 738 KBytes [ 7][RX-C] 20.00-30.00 sec 1.09 GBytes 937 Mbits/sec [ 5][TX-C] 30.00-40.00 sec 1.09 GBytes 937 Mbits/sec 0 738 KBytes [ 7][RX-C] 30.00-40.00 sec 1.09 GBytes 937 Mbits/sec [ 5][TX-C] 40.00-50.00 sec 1.09 GBytes 937 Mbits/sec 0 738 KBytes [ 7][RX-C] 40.00-50.00 sec 1.09 GBytes 937 Mbits/sec [ 5][TX-C] 50.00-60.00 sec 1.09 GBytes 938 Mbits/sec 0 738 KBytes [ 7][RX-C] 50.00-60.00 sec 1.09 GBytes 937 Mbits/sec - - - - - - - - - - - - - - - - - - - - - - - - - [ ID][Role] Interval Transfer Bitrate Retr [ 5][TX-C] 0.00-60.00 sec 6.55 GBytes 938 Mbits/sec 0 sender [ 5][TX-C] 0.00-60.00 sec 6.55 GBytes 938 Mbits/sec receiver [ 7][RX-C] 0.00-60.00 sec 6.55 GBytes 938 Mbits/sec 0 sender [ 7][RX-C] 0.00-60.00 sec 6.55 GBytes 937 Mbits/sec receiver iperf Done. |
CMI module 1 (left):
|
1 2 3 4 5 6 7 8 9 10 11 12 13 14 15 16 17 18 19 20 21 22 23 24 25 |
devkit@UPX-i11:~$ iperf3 -t 60 -c 192.168.31.107 -i 10 --bidir Connecting to host 192.168.31.107, port 5201 [ 5] local 192.168.31.12 port 37760 connected to 192.168.31.107 port 5201 [ 7] local 192.168.31.12 port 37776 connected to 192.168.31.107 port 5201 [ ID][Role] Interval Transfer Bitrate Retr Cwnd [ 5][TX-C] 0.00-10.00 sec 1.09 GBytes 940 Mbits/sec 0 557 KBytes [ 7][RX-C] 0.00-10.00 sec 1.09 GBytes 936 Mbits/sec [ 5][TX-C] 10.00-20.00 sec 1.09 GBytes 937 Mbits/sec 0 557 KBytes [ 7][RX-C] 10.00-20.00 sec 1.09 GBytes 937 Mbits/sec [ 5][TX-C] 20.00-30.00 sec 1.09 GBytes 938 Mbits/sec 0 557 KBytes [ 7][RX-C] 20.00-30.00 sec 1.09 GBytes 937 Mbits/sec [ 5][TX-C] 30.00-40.00 sec 1.09 GBytes 937 Mbits/sec 0 557 KBytes [ 7][RX-C] 30.00-40.00 sec 1.09 GBytes 937 Mbits/sec [ 5][TX-C] 40.00-50.00 sec 1.09 GBytes 938 Mbits/sec 0 557 KBytes [ 7][RX-C] 40.00-50.00 sec 1.09 GBytes 937 Mbits/sec [ 5][TX-C] 50.00-60.00 sec 1.09 GBytes 937 Mbits/sec 0 557 KBytes [ 7][RX-C] 50.00-60.00 sec 1.09 GBytes 937 Mbits/sec - - - - - - - - - - - - - - - - - - - - - - - - - [ ID][Role] Interval Transfer Bitrate Retr [ 5][TX-C] 0.00-60.00 sec 6.55 GBytes 938 Mbits/sec 0 sender [ 5][TX-C] 0.00-60.00 sec 6.55 GBytes 938 Mbits/sec receiver [ 7][RX-C] 0.00-60.00 sec 6.55 GBytes 938 Mbits/sec 0 sender [ 7][RX-C] 0.00-60.00 sec 6.55 GBytes 937 Mbits/sec receiver iperf Done. |
CMI module 2 (right):
|
1 2 3 4 5 6 7 8 9 10 11 12 13 14 15 16 17 18 19 20 21 22 23 24 25 |
devkit@UPX-i11:~$ iperf3 -t 60 -c 192.168.31.155 -i 10 --bidir Connecting to host 192.168.31.155, port 5201 [ 5] local 192.168.31.12 port 48830 connected to 192.168.31.155 port 5201 [ 7] local 192.168.31.12 port 48836 connected to 192.168.31.155 port 5201 [ ID][Role] Interval Transfer Bitrate Retr Cwnd [ 5][TX-C] 0.00-10.00 sec 1.09 GBytes 940 Mbits/sec 0 570 KBytes [ 7][RX-C] 0.00-10.00 sec 1.09 GBytes 938 Mbits/sec [ 5][TX-C] 10.00-20.00 sec 1.09 GBytes 938 Mbits/sec 0 857 KBytes [ 7][RX-C] 10.00-20.00 sec 1.09 GBytes 938 Mbits/sec [ 5][TX-C] 20.00-30.00 sec 1.09 GBytes 937 Mbits/sec 0 857 KBytes [ 7][RX-C] 20.00-30.00 sec 1.09 GBytes 938 Mbits/sec [ 5][TX-C] 30.00-40.00 sec 1.09 GBytes 937 Mbits/sec 0 857 KBytes [ 7][RX-C] 30.00-40.00 sec 1.09 GBytes 938 Mbits/sec [ 5][TX-C] 40.00-50.00 sec 1.09 GBytes 937 Mbits/sec 0 857 KBytes [ 7][RX-C] 40.00-50.00 sec 1.09 GBytes 938 Mbits/sec [ 5][TX-C] 50.00-60.00 sec 1.09 GBytes 938 Mbits/sec 0 857 KBytes [ 7][RX-C] 50.00-60.00 sec 1.09 GBytes 938 Mbits/sec - - - - - - - - - - - - - - - - - - - - - - - - - [ ID][Role] Interval Transfer Bitrate Retr [ 5][TX-C] 0.00-60.00 sec 6.55 GBytes 938 Mbits/sec 0 sender [ 5][TX-C] 0.00-60.00 sec 6.55 GBytes 938 Mbits/sec receiver [ 7][RX-C] 0.00-60.00 sec 6.55 GBytes 938 Mbits/sec 0 sender [ 7][RX-C] 0.00-60.00 sec 6.55 GBytes 938 Mbits/sec receiver iperf Done. |
It’s all good. There was no issue like in Windows where we got 938 Mbps in one direction and 622 Mbps in the other while testing bidirectional transfers with iperf3. It could either be Windows or an iperf3 in Windows issue.
Cincoze DS-1402 Ubuntu stress test with and without fan
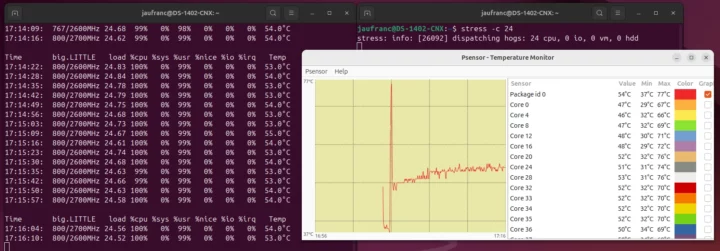
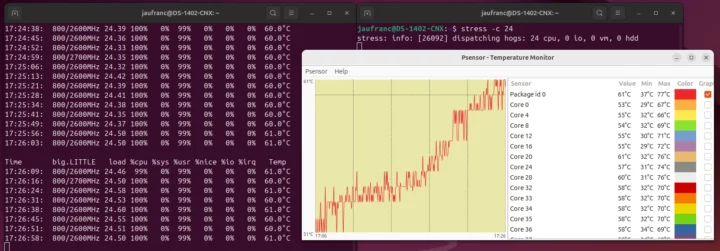
In order to evaluate the efficiency of the cooling, I ran a stress test on all 24 threads of the Core i9-12900E processor while monitoring CPU temperature and frequency with Psensor and sbc-bench.sh
For the first few seconds the temperature jumped up to 77°C with the P-cores clocked at 3800 MHz and the E-cores clocked at 3600 MHz:
|
1 2 3 4 5 6 7 8 9 10 11 |
17:03:39: 863/3797MHz 0.80 0% 0% 0% 0% 0% 0% 38.0°C 17:03:45: 800/3589MHz 0.73 0% 0% 0% 0% 0% 0% 38.0°C 17:03:50: 800/3670MHz 0.68 0% 0% 0% 0% 0% 0% 38.0°C 17:03:55: 800/3603MHz 0.70 0% 0% 0% 0% 0% 0% 37.0°C 17:04:00: 3800/3600MHz 0.73 23% 0% 22% 0% 0% 0% 68.0°C 17:04:05: 3800/3600MHz 3.15 100% 0% 99% 0% 0% 0% 76.0°C 17:04:12: 800/2700MHz 4.82 100% 0% 99% 0% 0% 0% 50.0°C Time big.LITTLE load %cpu %sys %usr %nice %io %irq Temp 17:04:19: 800/2700MHz 7.92 100% 0% 99% 0% 0% 0% 48.0°C 17:04:25: 800/2600MHz 9.21 100% 0% 99% 0% 0% 0% 50.0°C |
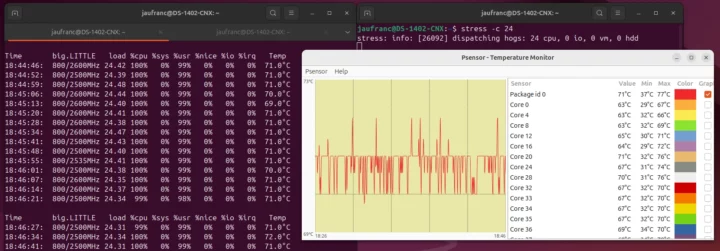
But the P-cores CPU frequency then stabilized at a lowly 800MHz and the E-cores ran at 2600 to 2700 MHz with the CPU temperature hovering at around 54°C after 12 minutes. That’s very far from the junction temperature (100°C), so I decided to disconnect the fan (around the 17:16:52 mark in sbc-bench.sh) and continue the test.
The CPU temperature slowly went up and after around 10 minutes, it reached 61-62°C. I went out and left the air conditioner at its current temperature (28°C).
I came back around 1h30 after disconnecting the fan, and the CPU temperature had stabilized around 70 to 71°C. That would imply the fan is optional, but we have to keep in mind the Cincoze DS-1402 is rated to run in the -40 to 50°C temperature range with the 65W Intel Core i9-12900E, and I did not stress other parts of the system which may further raise the package temperature. It still looks like it would be fine to run the Cincoze DS-1402 fanless even with a 65W CPU in some conditions. Note the company already offers the system in fanless configuration with 35W processors and a -40 to +70°C temperature range.
Cincoze DS-1402 power consumption with Ubuntu 24.04
I reconnected the fan and measured the power consumption with a wall power meter:
- Power off – 6.3 – 6.4 Watts
- Idle – 55.6 – 57.2 Watts
- Video playback – 113.7 – 123.1 Watts (Youtube 8K 60fps (AV1) in Firefox)
- CPU stress test (stress -c 24)
- First 10 seconds – Quick ramp up to 219.7 – 219.9 Watts
- Longer run – 95.5 – 95.9 Watts
During the measurements, the mini PC was connected to the LAN2 Ethernet port, two RF dongles (one for a keyboard, the other for a mouse), and a CrowView laptop monitor connected to HDMI and its own power adapter. What’s baffling is the idle power consumption on Ubuntu 24.04 (around 56 Watts) is much lower than on Windows 11 (around 95 Watts). I can see ASPM is disabled in Linux, so it’s not the reason. There must be something that’s always on on Windows 11 that’s turned off in Linux.
Conclusion
The takeaway for Linux will be similar to the one in Windows 11, as the Cincoze DS-1402 modular embedded computer works well in Ubuntu 24.04 in the configuration under test with an Intel Core i9-12900E 16-core/24-thread Alder Lake processor, 64GB DDR5, and a 512GB SSD, and I did not come across any major issues. The industrial-grade NVMe SSD provided with the test sample is not the fastest around, but the users can always customize the computer to use a faster SSD at the time of order. Initially, I had trouble playing a YouTube video at 8K 60 FPS, but I had no such issue in a subsequent attempt the next day with the same video.
I haven’t tested the fan in detail in Linux, but I can confirm it’s still very noisy. However, as our tests showed, the Cincoze DS-1402 can still work as a fanless embedded computer under some conditions with a 65W processor (as tested) and no fan is needed when configured with a 35W processor. Power consumption is quite high, but somehow the idle power consumption is much lower in Linux (56W) than in Windows (95W) for reason(s) that would need to be investigated. In any case, fan noise and relatively high power consumption would not typically be issues for the target applications such as oil and gas fields, factory floors, and mass transportation vehicles. What’s important is that the fan is placed outside on top of a metal case, so dust won’t get into the system easily compared to systems fitted with an internal fan.
I did not find any obvious issue, although as noted in the Windows review, the lack of faster Ethernet interfaces and a DIO header could be noted. However, it should not be a problem since the Cincoze DS-1402 is a modular embedded system and the company provides CMI expansion modules such as the CMI-10GLAN03-R10 with two Intel X550 10GbE RJ45 interfaces or the CMI-DIO02CMI module with 16x optically isolated DIO (8 in/8 out) among others.
The Cincoze DS-1402 is a solid and reliable system with impressive versatility thanks to a range of expansion modules and PCIe slots with a patented fixation system. It’s also adequate for harsh environments with shock and vibration certifications and a wide operating temperature range. The main consideration will likely be the price. You can build your own configuration on distributors such as Steatite or EG Electronics among others to find out the cost of a system that meets your requirements.

Jean-Luc started CNX Software in 2010 as a part-time endeavor, before quitting his job as a software engineering manager, and starting to write daily news, and reviews full time later in 2011.
Support CNX Software! Donate via cryptocurrencies, become a Patron on Patreon, or purchase goods on Amazon or Aliexpress


