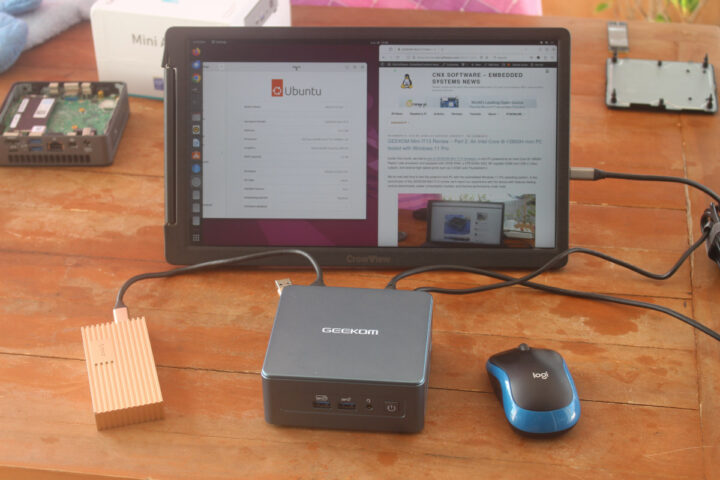
We published the review of the Core i9-13900H powered GEEKOM Mini IT13 mini PC in Windows 11 Pro earlier this week and have now installed Ubuntu 22.04 and tested the machine with the Linux-based operating system in detail with benchmarks, features testing, networking and storage performance tests, power consumption, and thermal performance which we will report in this third and final part of the review.
Installing Ubuntu 22.04 on GEEKOM Mini IT13
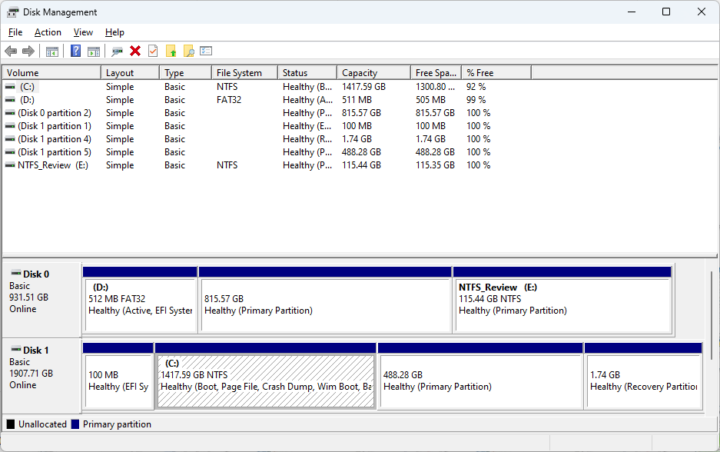
I shrank the Windows partition by about 500 MB in Disk Management in Windows 11 (Disk 1) in order to install Ubuntu 22.04.3 in dual boot configuration.
The installation went smoothly using WiFi 6 to retrieve newer files and I could log in to the Ubuntu 22.04 desktop. But there was a trick, as I had to go to Windows first to select “Advanced Startup” and select Ubuntu on the next boot since the GRUB menu would just not show. When I first went to the BIOS I could not see any Ubuntu option, so I tried to play around with /etc/default/grub and looked for a solution on the web, but nothing seemed to work. I finally decided to go back to the BIOS to have another look.
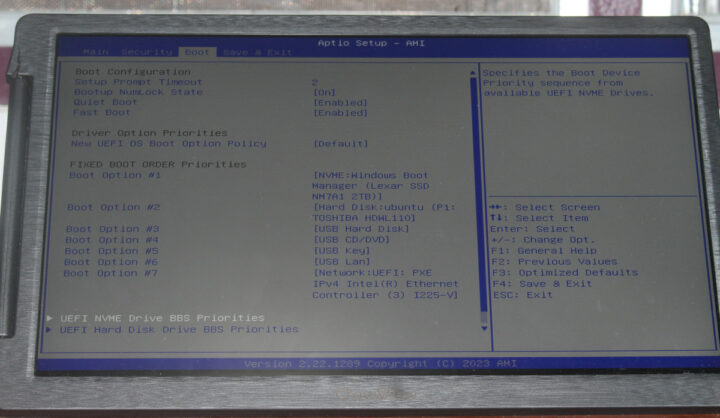
The important part is the “UEFI NVME Drive BBS Priorities” option at the bottom as the system was set to start Windows Boot Manager first…
So I changed that to Ubuntu, and the GRUB menu is now showing up allowing me to easily select Ubuntu or Windows at boot time.
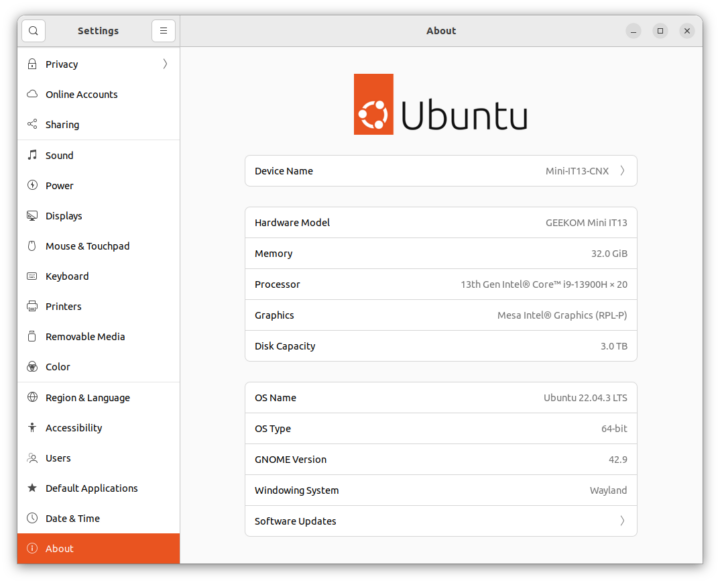
Ubuntu 22.04.3 system information
The system information in Ubuntu 22.04.3 shows the GEEKOM Mini IT13 hardware model with a 13th Gen, 20-thread Intel Core i9-13900H processor, 32GB of RAM, and 3TB of storage (2TB SSD + 1TB SATA drive) as expected.
Let’s type some commands in the terminal to get more information about the system:
|
1 2 3 4 5 6 7 8 9 10 11 12 13 14 15 16 |
jaufranc@Mini-IT13-CNX:~$ cat /etc/lsb-release DISTRIB_ID=Ubuntu DISTRIB_RELEASE=22.04 DISTRIB_CODENAME=jammy DISTRIB_DESCRIPTION="Ubuntu 22.04.3 LTS" jaufranc@Mini-IT13-CNX:~$ uname -a Linux Mini-IT13-CNX 6.2.0-37-generic #38~22.04.1-Ubuntu SMP PREEMPT_DYNAMIC Thu Nov 2 18:01:13 UTC 2 x86_64 x86_64 x86_64 GNU/Linux jaufranc@Mini-IT13-CNX:~$ df -mh Filesystem Size Used Avail Use% Mounted on tmpfs 3.2G 2.3M 3.2G 1% /run /dev/nvme0n1p5 480G 12G 444G 3% / tmpfs 16G 0 16G 0% /dev/shm tmpfs 5.0M 4.0K 5.0M 1% /run/lock /dev/nvme0n1p1 96M 81M 16M 84% /boot/efi tmpfs 3.2G 76K 3.2G 1% /run/user/128 tmpfs 3.2G 68K 3.2G 1% /run/user/1000 |
|
1 2 3 4 5 6 7 8 9 10 11 12 13 14 15 16 17 18 19 20 21 22 23 24 25 26 27 28 29 30 31 32 33 34 35 36 37 38 39 40 41 42 43 44 45 46 47 48 49 50 |
jaufranc@Mini-IT13-CNX:~$ sudo inxi -Fc0 System: Host: Mini-IT13-CNX Kernel: 6.2.0-37-generic x86_64 bits: 64 Console: pty pts/1 Distro: Ubuntu 22.04.3 LTS (Jammy Jellyfish) Machine: Type: Desktop System: GEEKOM product: Mini IT13 v: N/A serial: 1571C23380094 Mobo: N/A model: N/A serial: NUCRL01A144NNNNG1390100103 UEFI: American Megatrends LLC. v: 1.04 date: 08/16/2023 CPU: Info: 14-core (6-mt/8-st) model: 13th Gen Intel Core i9-13900H bits: 64 type: MST AMCP cache: L2: 11.5 MiB Speed (MHz): avg: 2535 min/max: 400/5200:5400:4100 cores: 1: 3000 2: 3000 3: 1244 4: 455 5: 533 6: 3000 7: 3000 8: 3000 9: 3000 10: 3000 11: 470 12: 3000 13: 3000 14: 3000 15: 3000 16: 3000 17: 3000 18: 3000 19: 3000 20: 3000 Graphics: Device-1: Intel driver: i915 v: kernel Display: server: X.org v: 1.21.1.4 with: Xwayland v: 22.1.1 driver: gpu: i915 note: X driver n/a tty: 80x24 resolution: 1920x1080 Message: GL data unavailable in console for root. Audio: Device-1: Intel driver: snd_hda_intel Sound Server-1: ALSA v: k6.2.0-37-generic running: yes Sound Server-2: PulseAudio v: 15.99.1 running: yes Sound Server-3: PipeWire v: 0.3.48 running: yes Network: Device-1: Intel driver: iwlwifi IF: wlo1 state: up mac: e0:c2:64:96:bb:ee Device-2: Intel Ethernet I225-V driver: igc IF: enp86s0 state: down mac: 38:f7:cd:c6:40:26 Bluetooth: Device-1: Intel type: USB driver: btusb Report: hciconfig ID: hci0 state: up address: E0:C2:64:96:BB:F2 Drives: Local Storage: total: 2.77 TiB used: 11.77 GiB (0.4%) ID-1: /dev/nvme0n1 vendor: Lexar model: SSD NM7A1 2TB size: 1.86 TiB ID-2: /dev/sda vendor: Toshiba model: HDWL110 size: 931.51 GiB Partition: ID-1: / size: 479.55 GiB used: 11.7 GiB (2.4%) fs: ext4 dev: /dev/nvme0n1p5 ID-2: /boot/efi size: 96 MiB used: 80.3 MiB (83.7%) fs: vfat dev: /dev/nvme0n1p1 Swap: Alert: No swap data was found. Sensors: System Temperatures: cpu: 27.8 C mobo: N/A Fan Speeds (RPM): N/A Info: Processes: 399 Uptime: 4m Memory: 31.1 GiB used: 1.22 GiB (3.9%) Init: systemd runlevel: 5 Shell: Sudo inxi: 3.3.13 |
inxi correctly reports six P-cores as 6-mt (multi-thread) and eight E-cores as 8-st (single-thread) with the maximum frequency reported to be 5.2 GHz or 5.4 GHz for the P-cores, and 4.1 GHz for the E-cores. It seems odd to have three different maximum turbo frequencies, but sbc-bench.sh script (see below) will report two of the P-Cores (four threads) can run up to 5.4 GHz and the rest can only go up to 5.2 GHz. The idle temperature is shown to be 27.8°C which does not seem right…
Ubuntu 22.04 Benchmarks on GEEKOM Mini IT13
Let’s install and run sbc-bench.sh:
|
1 2 3 4 5 6 7 8 9 10 11 12 13 14 15 16 17 18 19 20 21 22 23 24 25 26 27 28 29 30 31 32 33 34 35 36 37 38 39 40 41 42 43 44 45 46 47 48 49 50 51 52 53 54 55 56 57 58 59 60 61 62 63 64 65 66 67 68 69 70 71 72 73 74 75 76 77 78 79 80 81 82 83 84 85 86 87 88 89 90 91 92 93 94 95 96 97 98 99 100 101 102 103 104 105 106 107 108 109 110 111 112 113 114 115 116 117 118 119 120 121 122 123 124 125 126 127 128 129 130 131 132 133 134 135 136 137 138 139 140 141 142 143 144 145 146 147 148 149 150 151 152 153 154 155 156 157 158 159 160 161 162 163 164 165 166 167 168 169 170 |
wget https://github.com/ThomasKaiser/sbc-bench/raw/master/sbc-bench.sh chmod +x sbc-bench.sh jaufranc@Mini-IT13-CNX:~$ sudo ./sbc-bench.sh -r Starting to examine hardware/software for review purposes... sbc-bench v0.9.54 Installing needed tools: apt -f -qq -y install gcc make build-essential bsdmainutils curl git sysstat powercap-utils binutils mmc-utils smartmontools stress-ng p7zip, tinymembench, ramlat, mhz (can't build cpuminer) Done. Checking cpufreq OPP. Done. Executing tinymembench. Done. Executing RAM latency tester. Done. Executing OpenSSL benchmark. Done. Executing 7-zip benchmark. Done. Throttling test: heating up the device, 5 more minutes to wait. Done. Checking cpufreq OPP again. Done (13 minutes elapsed). Results validation: * Measured clockspeed not lower than advertised max CPU clockspeed * Background activity (%system) OK * Powercap detected. Details: "sudo powercap-info -p intel-rapl" Full results uploaded to http://ix.io/4Mez # GEEKOM Mini IT13 / i9-13900H Tested with sbc-bench v0.9.54 on Thu, 23 Nov 2023 18:03:32 +0700. Full info: [http://ix.io/4Mez](http://ix.io/4Mez) ### General information: The CPU features 2 clusters of different core types: i9-13900H, Kernel: x86_64, Userland: amd64 CPU sysfs topology (clusters, cpufreq members, clockspeeds) cpufreq min max CPU cluster policy speed speed core type 0 0 0 400 5200 Raptor Cove 1 0 1 400 5200 Raptor Cove 2 0 2 400 5400 Raptor Cove 3 0 3 400 5400 Raptor Cove 4 0 4 400 5200 Raptor Cove 5 0 5 400 5200 Raptor Cove 6 0 6 400 5200 Raptor Cove 7 0 7 400 5200 Raptor Cove 8 0 8 400 5400 Raptor Cove 9 0 9 400 5400 Raptor Cove 10 0 10 400 5200 Raptor Cove 11 0 11 400 5200 Raptor Cove 12 0 12 400 4100 Gracemont 13 0 13 400 4100 Gracemont 14 0 14 400 4100 Gracemont 15 0 15 400 4100 Gracemont 16 0 16 400 4100 Gracemont 17 0 17 400 4100 Gracemont 18 0 18 400 4100 Gracemont 19 0 19 400 4100 Gracemont 31844 KB available RAM ### Governors/policies (performance vs. idle consumption): Original governor settings: cpufreq-policy0: powersave / 1049 MHz (performance powersave) cpufreq-policy10: powersave / 704 MHz (performance powersave) cpufreq-policy11: powersave / 3000 MHz (performance powersave) cpufreq-policy12: powersave / 3000 MHz (performance powersave) cpufreq-policy13: powersave / 3000 MHz (performance powersave) cpufreq-policy14: powersave / 3000 MHz (performance powersave) cpufreq-policy15: powersave / 3000 MHz (performance powersave) cpufreq-policy16: powersave / 759 MHz (performance powersave) cpufreq-policy17: powersave / 3000 MHz (performance powersave) cpufreq-policy18: powersave / 3000 MHz (performance powersave) cpufreq-policy19: powersave / 3000 MHz (performance powersave) cpufreq-policy1: powersave / 529 MHz (performance powersave) cpufreq-policy2: powersave / 1937 MHz (performance powersave) cpufreq-policy3: powersave / 3000 MHz (performance powersave) cpufreq-policy4: powersave / 1605 MHz (performance powersave) cpufreq-policy5: powersave / 3000 MHz (performance powersave) cpufreq-policy6: powersave / 3270 MHz (performance powersave) cpufreq-policy7: powersave / 3000 MHz (performance powersave) cpufreq-policy8: powersave / 3103 MHz (performance powersave) cpufreq-policy9: powersave / 3000 MHz (performance powersave) Tuned governor settings: cpufreq-policy0: performance / 3843 MHz cpufreq-policy10: performance / 4322 MHz cpufreq-policy11: performance / 3000 MHz cpufreq-policy12: performance / 3000 MHz cpufreq-policy13: performance / 3000 MHz cpufreq-policy14: performance / 3000 MHz cpufreq-policy15: performance / 3000 MHz cpufreq-policy16: performance / 2614 MHz cpufreq-policy17: performance / 701 MHz cpufreq-policy18: performance / 400 MHz cpufreq-policy19: performance / 3000 MHz cpufreq-policy1: performance / 400 MHz cpufreq-policy2: performance / 3756 MHz cpufreq-policy3: performance / 3239 MHz cpufreq-policy4: performance / 3296 MHz cpufreq-policy5: performance / 3000 MHz cpufreq-policy6: performance / 3827 MHz cpufreq-policy7: performance / 3000 MHz cpufreq-policy8: performance / 3278 MHz cpufreq-policy9: performance / 3000 MHz Status of performance related policies found below /sys: /sys/module/pcie_aspm/parameters/policy: default [performance] powersave powersupersave ### Clockspeeds (idle vs. heated up): Before at 50.0°C: cpu0-cpu11 (Raptor Cove): OPP: 5200, Measured: 5187 cpu12-cpu19 (Gracemont): OPP: 4100, Measured: 4089 After at 76.0°C: cpu0-cpu11 (Raptor Cove): OPP: 5200, Measured: 5188 cpu12-cpu19 (Gracemont): OPP: 4100, Measured: 4089 ### Performance baseline * cpu0 (Raptor Cove): memcpy: 24014.4 MB/s, memchr: 39937.0 MB/s, memset: 26647.9 MB/s * cpu12 (Gracemont): memcpy: 9447.6 MB/s, memchr: 13927.4 MB/s, memset: 10359.4 MB/s * cpu0 (Raptor Cove) 16M latency: 19.20 17.52 17.96 17.61 17.90 17.57 18.77 25.99 * cpu12 (Gracemont) 16M latency: 30.71 28.43 30.76 28.62 31.57 27.78 27.08 27.63 * cpu0 (Raptor Cove) 128M latency: 76.71 73.29 75.48 70.93 76.70 70.36 72.90 74.13 * cpu12 (Gracemont) 128M latency: 99.28 99.09 99.64 99.36 98.94 96.77 96.66 98.66 * 7-zip MIPS (3 consecutive runs): 60981, 54075, 54563 (56540 avg), single-threaded: 6686 * `aes-256-cbc 1523160.10k 1804337.83k 1834406.74k 1842075.65k 1838983.85k 1844401.49k (Raptor Cove)` * `aes-256-cbc 1128098.30k 1422429.97k 1470380.97k 1482875.90k 1486476.63k 1478448.47k (Gracemont)` ### PCIe and storage devices: * Intel Ethernet I225-V: Speed 5GT/s (ok), Width x1 (ok), driver in use: igc * O2 SD/MMC Card Reader: Speed 2.5GT/s (ok), Width x1 (ok), driver in use: sdhci-pci * 1.9TB "Lexar SSD NM7A1 2TB" SSD as /dev/nvme0: Speed 16GT/s (ok), Width x4 (ok), 0% worn out, drive temp: 50°C * 931.5GB "Toshiba TOSHIBA HDWL110" HDD as /dev/sda: SATA 3.3, 6.0 Gb/s (current: 6.0 Gb/s), drive temp: 37°C * Macronix MX25L25635E 32MB SPI NOR flash, drivers in use: spi-nor/intel-spi ### Challenging filesystems: The following partitions are NTFS: sda3,nvme0n1p3,nvme0n1p4 When this OS uses FUSE/userland methods to access NTFS filesystems performance will be significantly harmed or at least likely be bottlenecked by maxing out one or more CPU cores. It is highly advised when benchmarking with any NTFS to monitor closely CPU utilization or better switch to a 'Linux native' filesystem like ext4 since representing 'storage performance' a lot more than 'somewhat dealing with a foreign filesystem' as with NTFS. ### Software versions: * Ubuntu 22.04.3 LTS * Compiler: /usr/bin/gcc (Ubuntu 11.4.0-1ubuntu1~22.04) 11.4.0 / x86_64-linux-gnu * OpenSSL 3.0.2, built on 15 Mar 2022 (Library: OpenSSL 3.0.2 15 Mar 2022) ### Kernel info: * `/proc/cmdline: BOOT_IMAGE=/boot/vmlinuz-6.2.0-37-generic root=UUID=e73a3f7f-1672-42b3-ac7b-58a6e2ccb1e9 ro quiet splash vt.handoff=7` * Vulnerability Spec store bypass: Mitigation; Speculative Store Bypass disabled via prctl * Vulnerability Spectre v1: Mitigation; usercopy/swapgs barriers and __user pointer sanitization * Vulnerability Spectre v2: Mitigation; Enhanced IBRS, IBPB conditional, RSB filling, PBRSB-eIBRS SW sequence * Kernel 6.2.0-37-generic / CONFIG_HZ=250 Waiting for the device to cool down............................ 43.0° |
The utility did not detect any CPU throttling, but if we look at the 7-zip benchmark we can see the first score (60981) is quite higher than the two subsequent scores (54075 and 54563). That’s because, as we’ve seen in Windows, the Core i9-13900H will run with a very high performance (and power draw) during the first few seconds, and then the power limits kick in making the CPU run at a quite lower, but sustainable, frequencies with lower CPU temperature meaning no thermal throttling has to occur. It’s winter here, so instead of running the script in a room with an ambient temperature of about 28-30°C, it was more like 25-27°C.
Let’s check the power limits of the system with powercap-info as instructed by sbc-bench.sh:
|
1 2 3 4 5 6 7 8 9 10 11 12 13 14 15 16 17 18 19 20 21 22 23 24 25 26 27 28 29 30 31 32 33 34 35 36 37 38 39 40 41 42 43 44 45 46 47 48 49 50 51 52 53 |
jaufranc@Mini-IT13-CNX:~$ sudo powercap-info -p intel-rapl enabled: 1 Zone 0 name: package-0 enabled: 1 max_energy_range_uj: 262143328850 energy_uj: 51762539728 Constraint 0 name: long_term power_limit_uw: 200000000 time_window_us: 27983872 max_power_uw: 45000000 Constraint 1 name: short_term power_limit_uw: 80000000 time_window_us: 2440 max_power_uw: 0 Constraint 2 name: peak_power power_limit_uw: 100000000 time_window_us: 0 max_power_uw: 0 Zone 0:0 name: core enabled: 0 max_energy_range_uj: 262143328850 energy_uj: 19164293407 Constraint 0 name: long_term power_limit_uw: 0 time_window_us: 976 Zone 0:1 name: uncore enabled: 0 max_energy_range_uj: 262143328850 energy_uj: 919187 Constraint 0 name: long_term power_limit_uw: 0 time_window_us: 976 Zone 1 name: psys enabled: 0 max_energy_range_uj: 262143328850 energy_uj: 2021648633 Constraint 0 name: long_term power_limit_uw: 0 time_window_us: 27983872 Constraint 1 name: short_term power_limit_uw: 0 time_window_us: 976 |
If I read that right, PL1 (Long duration) is set to 20W, and PL2 (Short duration) is set to 80W. Intel advertises the Core i9-13900H with a default TDP of 45W, and in Windows 11 it was set to 35W (PL1) and 45W (PL2) respectively.
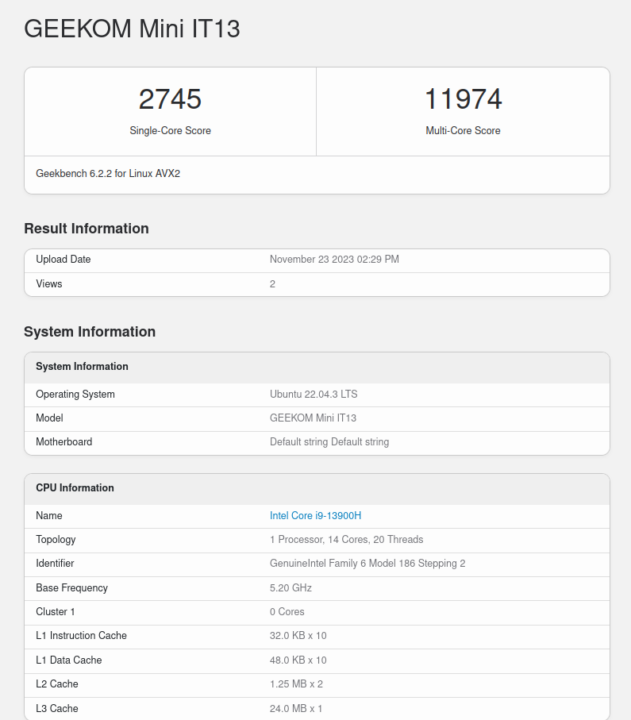
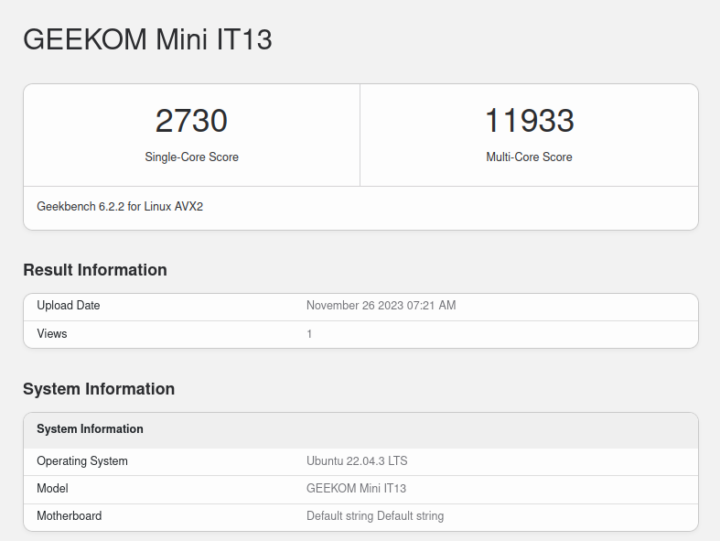
We’ve also run Geekbench 6 64-bit.
The multi-core score is only 4.34 times higher on a 20-thread Intel Core i9-13900H processor, so while performance is better than on other mini PCs we’ve tested, CPU throttling likely occurred. You’ll find the full results at https://browser.geekbench.com/v6/cpu/3677470.
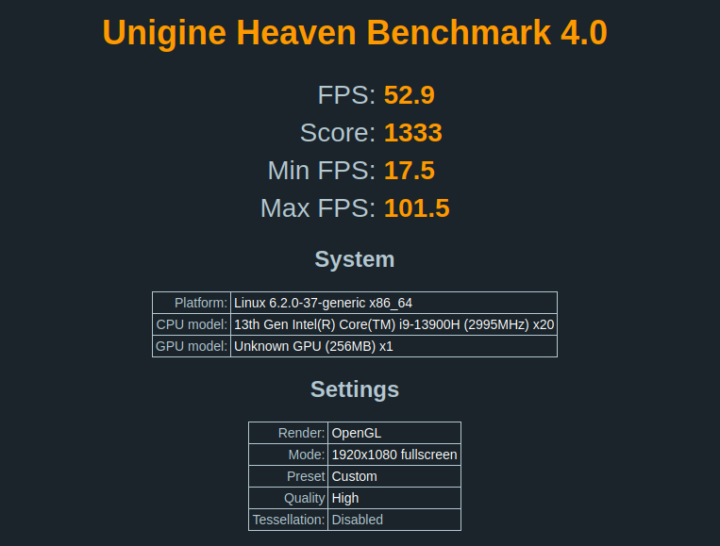
We started GPU performance testing with Unigine Heaven Benchmark 4.0.
That’s 52.9 fps and a 1,333 score at 1920×1080 resolution, or quite similar to what we got in the Khadas Mind Premium, but that should not come as a surprise since the processors in both systems feature 96EU Intel Iris Xe graphics.
For real-world testing of the internal GPU (iGPU), I played some YouTube videos starting in Firefox with a 4K 60FPS video that played smoothly with just a few frames dropped at the beginning.

I then confidently switched to an 8K 60 fps video, but this was a disaster and all I could see was a still image with the dropped frames counter going up constantly.

I thought it might be better with Chrome, but the video was really choppy with plenty of dropped frames and unwatchable.

I tried another 8K video at 60 fps, but the result was the same. So I lowered my expectations and found an 8K video at 30 fps which played smoothly in Chrome…

as well as in Firefox.

For reference, all five video samples used the AV1 video codec.
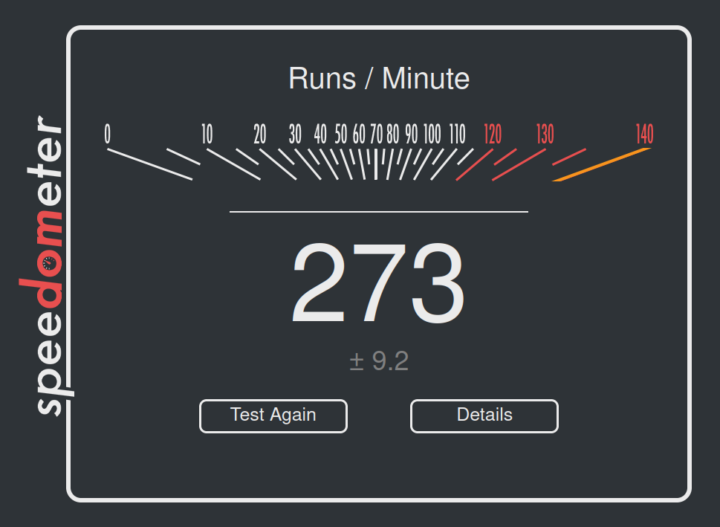
I also ran Speedometer 2.0 with Firefox 116 to evaluate web browsing performance.
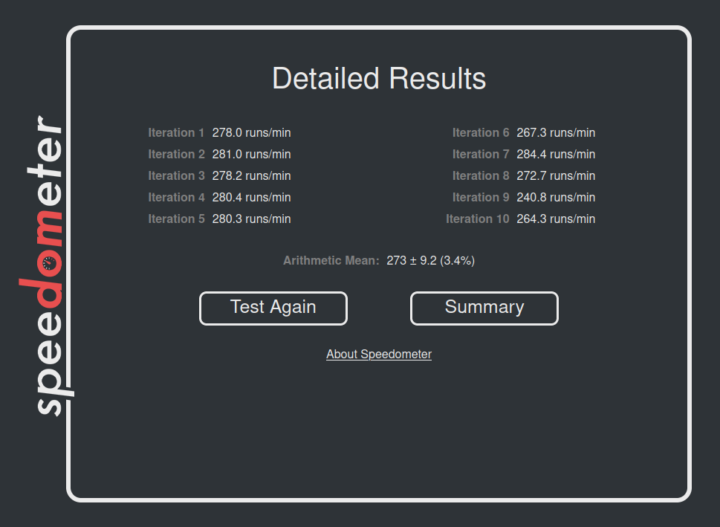
The score was 273 (runs per minute) or the highest score on any of the mini PCs we’ve reviewed. It’s also useful to click on the Details button to look at the 10 iterations of the test.
The first five iterations are closer to 280 runs per minute, and the five other scores fluctuate between 240 and 284 runs probably because of the high performance when starting the test before the power limits are triggered and make the system run slower. Web browsing relies a lot on single-thread performance and the higher scores would likely be more representative since users are not constantly reloading multiple web pages…
GEEKOM Mini IT13 vs Mini IT 11 vs GEEKOM AS 6 vs Khadas Mind Premium
Let’s compare Ubuntu 22.04 benchmark results from GEEKOM Mini IT13 mini PC with the ones of GEEKOM IT11 (11th Gen Core i7-11390H Tiger Lake), GEEKOM AS 6 (AMD Ryzen 9 6900HX), and Khadas Mind Premium (13th Gen Core i7-1360P Raptor Lake). Note the earlier review where done in a room with a 28-30°C ambient temperature, while the GEEKOM Mini IT13 review was done with an ambient temperature of 25-27°C, but I’m not sure this matters that much since power limits appear to be more important than thermal limits with the Mini IT13 with its default TDP.
Here’s a quick summary of the main features of the four mini PCs.
| GEEKOM Mini IT13 | GEEKOM IT11 | GEEKOM AS 6 | Khadas Mind Premium | |
|---|---|---|---|---|
| SoC | Intel Core i9-13900H | Intel Core i7-11390H | AMD Ryzen 9 6900HX | Intel Core i7-1360P |
| CPU | 14-core/20-core Raptor Lake processor with 6 performance cores @ up to 5.4 GHz, 8 efficiency cores @ up to 4.1 GHz | 4-core/8-thread Tiger Lake processor up to 5.0 GHz | 8-core/16-thread processor up to 4.9 GHz | 12-core/16-core Raptor Lake processor with 4 performance cores @ up to 5.0 GHz, 8 efficiency cores @ up to 3.7 GHz |
| GPU | 96 EU Intel Iris Xe Graphics up to 1.5 GHz | 96 EU Intel Iris Xe Graphics up to 1.4 GHz | AMD Radeon Graphics 680M | 96 EU Intel Iris Xe Graphics up to 1.5 GHz |
| Memory | 32GB DDR4-3200 | 32GB DDR4 | 32GB DDR5-4800 | 32GB LPDDR5 @ 5200Mbps |
| Storage | 2TB NVMe SSD | 1TB NVMe SSD | 1TB NVMe SSD | 1TB NVMe SSD |
| Default OS | Windows 11 Pro | Windows 11 Pro | Windows 11 Pro | Windows 11 Home |
Ubuntu 22.04 benchmarks comparison table:
| GEEKOM Mini IT13 | GEEKOM Mini IT11 | GEEKOM AS 6 | Khadas Mind Premium | |
|---|---|---|---|---|
| sbc-bench.sh | ||||
| - memcpy | 24,014.4 (P-core) | 19,734 MB/s | 19,131.7 MB/s | 25,389.5 MB/s (P-core) |
| - memset | 26,647.9 (P-Core) | 45,636.7 MB/s | 16,781.4 MB/s | 24,731.8MB/s (P-core) |
| - 7-zip (average) | 56,540 | 25,167 | 54,592 | 44,430 |
| - 7-zip (top result) | 60,981 | 25,401 | 56,251 | 50,396 |
| - OpenSSL AES-256 16K | 1,844,401.49k (P-Core) | 1,707,917.31k | 1,249,203.54k | 1,771,334.31k (P-Core) |
| Geekbench 6 Single | 2,745 | 1,977 | 1,992 | 2093 |
| Geekbench 6 Multi | 11,974 | 5,729 | 9,535 | 8,891 |
| Unigine Heaven score | 1,333 | 1,079 | 1,553 | 1,349 |
| Speedometer (Firefox) | 273 | N/A | 202 | 242 |
Just as we noted in Windows 11, the GEEKOM Mini IT13 is the fastest mini PC we’ve tested with Ubuntu 22.04, except for memory bandwidth (likely because it’s using DDR4 instead of DDR5 memory) and 3D graphics performance where the Radeon GPU found in the AMD Ryzen 9 6900HX still outperforms the Intel Iris Xe graphics found in 13th gen Raptor Lake processors.
Storage testing
We tested the performance of the preinstalled 2TB NVMe SSD with iozone3:
|
1 2 3 4 5 6 7 8 9 10 11 12 13 14 |
jaufranc@Mini-IT13-CNX:~$ sudo iozone -e -I -a -s 1000M -r 4k -r 16k -r 512k -r 1024k -r 16384k -i 0 -i 1 -i 2 Iozone: Performance Test of File I/O Version $Revision: 3.489 $ Compiled for 64 bit mode. Build: linux-AMD64 random random bkwd record stride kB reclen write rewrite read reread read write read rewrite read fwrite frewrite fread freread 1024000 4 440643 523843 509297 508341 85334 490995 1024000 16 1354733 1582997 1331764 1334354 254371 1369164 1024000 512 4203129 4395245 4223743 4294942 2784349 4218433 1024000 1024 4304563 4439798 3599929 3669344 3257381 4211095 1024000 16384 3693375 4198959 4347599 4394373 4351844 4194589 iozone test complete. |
Performance is excellent with 4.34 GB/s and 3.69 GB/s sequential read and write speeds respectively, only beaten by the model (WD PC SN740) found in the Khadas Mind Premium. Note that the numbers reported by iozone3 (ext-4 file system) are lower than the ones reported by CrystalDiskMark in Windows (NTFS), but that always seems to be the case.
We then connected an ORICO M234C3-U4 “USB4” M.2 NVMe SSD enclosure and formatted the drive with EXT-4 file system to double-check each of the USB port’s speed using lsusb and iozone3. For example, here are the results for the front left USB 3.2 port of the MINI IT13:
|
1 2 3 4 5 6 7 8 9 10 11 |
jaufranc@Mini-IT13-CNX:~$ lsusb -t /: Bus 04.Port 1: Dev 1, Class=root_hub, Driver=xhci_hcd/4p, 10000M |__ Port 2: Dev 2, If 0, Class=Mass Storage, Driver=uas, 10000M /: Bus 03.Port 1: Dev 1, Class=root_hub, Driver=xhci_hcd/12p, 480M |__ Port 1: Dev 2, If 0, Class=Human Interface Device, Driver=usbhid, 12M |__ Port 2: Dev 3, If 0, Class=Human Interface Device, Driver=usbhid, 12M |__ Port 2: Dev 3, If 1, Class=Human Interface Device, Driver=usbhid, 12M |__ Port 10: Dev 4, If 0, Class=Wireless, Driver=btusb, 12M |__ Port 10: Dev 4, If 1, Class=Wireless, Driver=btusb, 12M /: Bus 02.Port 1: Dev 1, Class=root_hub, Driver=xhci_hcd/4p, 20000M/x2 /: Bus 01.Port 1: Dev 1, Class=root_hub, Driver=xhci_hcd/1p, 480M |
|
1 2 3 4 5 |
jaufranc@Mini-IT13-CNX:/media/sdb1$ sudo iozone -e -I -a -s 100M -r 16384k -i 0 -i 1 random random bkwd record stride kB reclen write rewrite read reread read write read rewrite read fwrite frewrite fread freread 102400 16384 953360 946904 859240 880189 |
A 10 Gbps port is detected and iozone measured an 859 MB/s read speed (and 953 MB/s write) that is consistent with a 10 Gbps port, albeit on the low side.
Since the Mini IT13 also comes with two Thunderbolt 4 (USB4) ports, the drive will also be mounted as an NVMe drive instead of a USB drive, so a different tool (boltctl) is needed to check the speed on the USB-C port. Here’s the output for the left port when facing the rear panel:
|
1 2 3 4 5 6 7 8 9 10 11 12 13 14 15 16 17 18 19 |
jaufranc@Mini-IT13-CNX:~$ boltctl ● Intel USB4.0 SSD ├─ type: peripheral ├─ name: USB4.0 SSD ├─ vendor: Intel ├─ uuid: ba010000-0052-541e-03d5-47dc2cd4b008 ├─ generation: Thunderbolt 3 ├─ status: authorized │ ├─ domain: 2d788780-91ad-8406-ffff-ffffffffffff │ ├─ rx speed: 40 Gb/s = 2 lanes * 20 Gb/s │ ├─ tx speed: 40 Gb/s = 2 lanes * 20 Gb/s │ └─ authflags: none Segmentation fault (core dumped) jaufranc@Mini-IT13-CNX:~$ pmount /dev/nvme1n1p1 jaufranc@Mini-IT13-CNX:~$ cd /media/nvme1n1p1/ jaufranc@Mini-IT13-CNX:/media/nvme1n1p1$ sudo iozone -e -I -a -s 1000M -r 16384k -i 0 -i 1 kB reclen write rewrite read reread read write read rewrite read fwrite frewrite fread freread 1024000 16384 2166955 2156119 2162549 2169611 |
A Thunderbolt 3 (40 Gbps) device is detected and iozone reports a 2,162 MB/s read speed that’s about the maximum we can achieve with this drive.
Here are the results for the Mini IT13’s front panel (left to right) in Ubuntu 22.04
- USB-A #1 – 10 Gbps – 859 MB/s
- USB-A #2 – 10 Gbps – 846 MB/s
We did the same test for the Mini IT13’s rear panel (left to right)
- USB-C #1 – Thunderbolt 3 40 Gbps – 2162.55 MB/s
- USB-A #1 (Top) – 10 Gbps – 835.14 MB/s
- USB-A #2 (Bottom) – 480 Mbps – 44.36 MB/s (The ORICO enclosure does not support USB 2.0, so we had to connect a USB hard drive for testing)
- USB-C #2 – Thunderbolt 3 40 Gbps – 2161,50 MB/s
So everything is as advertised and no problem here. Again, the numbers for the USB 3.2 (10 Gbps) ports with iozone3 are just quite lower than in Windows 11 with CrystalDiskMark (around 1,040 MB/s).
Finally, I tested the SATA interface with a 1TB hard drive using iozone3:
|
1 2 3 4 |
jaufranc@Mini-IT13-CNX:/media/sda2$ sudo iozone -e -I -a -s 100M -r 16384k -i 0 -i 1 random random bkwd record stride kB reclen write rewrite read reread read write read rewrite read fwrite frewrite fread freread 102400 16384 127892 128612 127215 135130 |
127.2 MB/s read speed and 127.89 MB/s write speed seem about right for this drive.
Networking (2.5GbE and WiFI 6) performance in Ubuntu 22.04
Time to switch to networking performance test for both 2.5GbE and WiFi 6 using iperf3.
Let’s start with 2.5GbE using UP Xtreme i11 mini PC (192.168.31.12) on the other side.
- Upload
|
1 2 3 4 5 6 7 8 9 10 11 12 13 14 |
jaufranc@Mini-IT13-CNX:~$ iperf3 -t 60 -c 192.168.31.12 -i 10 Connecting to host 192.168.31.12, port 5201 [ 5] local 192.168.31.15 port 41304 connected to 192.168.31.12 port 5201 [ ID] Interval Transfer Bitrate Retr Cwnd [ 5] 0.00-10.00 sec 2.74 GBytes 2.35 Gbits/sec 357 652 KBytes [ 5] 10.00-20.00 sec 2.74 GBytes 2.35 Gbits/sec 0 652 KBytes [ 5] 20.00-30.00 sec 2.74 GBytes 2.35 Gbits/sec 0 1.60 MBytes [ 5] 30.00-40.00 sec 2.74 GBytes 2.35 Gbits/sec 0 1.60 MBytes [ 5] 40.00-50.00 sec 2.74 GBytes 2.35 Gbits/sec 0 1.60 MBytes [ 5] 50.00-60.00 sec 2.74 GBytes 2.35 Gbits/sec 0 2.41 MBytes - - - - - - - - - - - - - - - - - - - - - - - - - [ ID] Interval Transfer Bitrate Retr [ 5] 0.00-60.00 sec 16.4 GBytes 2.35 Gbits/sec 357 sender [ 5] 0.00-60.04 sec 16.4 GBytes 2.35 Gbits/sec receiver |
- Download:
|
1 2 3 4 5 6 7 8 9 10 11 12 13 14 15 |
jaufranc@Mini-IT13-CNX:~$ iperf3 -t 60 -c 192.168.31.12 -i 10 -R Connecting to host 192.168.31.12, port 5201 Reverse mode, remote host 192.168.31.12 is sending [ 5] local 192.168.31.15 port 53460 connected to 192.168.31.12 port 5201 [ ID] Interval Transfer Bitrate [ 5] 0.00-10.00 sec 2.74 GBytes 2.35 Gbits/sec [ 5] 10.00-20.00 sec 2.74 GBytes 2.35 Gbits/sec [ 5] 20.00-30.00 sec 2.74 GBytes 2.35 Gbits/sec [ 5] 30.00-40.00 sec 2.74 GBytes 2.35 Gbits/sec [ 5] 40.00-50.00 sec 2.74 GBytes 2.35 Gbits/sec [ 5] 50.00-60.00 sec 2.74 GBytes 2.35 Gbits/sec - - - - - - - - - - - - - - - - - - - - - - - - - [ ID] Interval Transfer Bitrate Retr [ 5] 0.00-60.04 sec 16.4 GBytes 2.35 Gbits/sec 1 sender [ 5] 0.00-60.00 sec 16.4 GBytes 2.35 Gbits/sec receiver |
- Full-duplex (bidirectional)
|
1 2 3 4 5 6 7 8 9 10 11 12 13 14 15 16 17 18 19 20 21 22 23 24 25 |
jaufranc@Mini-IT13-CNX:~$ iperf3 -t 60 -c 192.168.31.12 -i 10 --bidir Connecting to host 192.168.31.12, port 5201 [ 5] local 192.168.31.15 port 57680 connected to 192.168.31.12 port 5201 [ 7] local 192.168.31.15 port 57686 connected to 192.168.31.12 port 5201 [ ID][Role] Interval Transfer Bitrate Retr Cwnd [ 5][TX-C] 0.00-10.00 sec 2.73 GBytes 2.35 Gbits/sec 0 1.01 MBytes [ 7][RX-C] 0.00-10.00 sec 2.73 GBytes 2.35 Gbits/sec [ 5][TX-C] 10.00-20.00 sec 2.73 GBytes 2.35 Gbits/sec 0 1.26 MBytes [ 7][RX-C] 10.00-20.00 sec 2.73 GBytes 2.35 Gbits/sec [ 5][TX-C] 20.00-30.00 sec 2.73 GBytes 2.35 Gbits/sec 0 1.26 MBytes [ 7][RX-C] 20.00-30.00 sec 2.73 GBytes 2.35 Gbits/sec [ 5][TX-C] 30.00-40.00 sec 2.73 GBytes 2.35 Gbits/sec 0 1.26 MBytes [ 7][RX-C] 30.00-40.00 sec 2.73 GBytes 2.35 Gbits/sec [ 5][TX-C] 40.00-50.00 sec 2.73 GBytes 2.35 Gbits/sec 0 1.89 MBytes [ 7][RX-C] 40.00-50.00 sec 2.73 GBytes 2.35 Gbits/sec [ 5][TX-C] 50.00-60.00 sec 2.73 GBytes 2.35 Gbits/sec 0 1.89 MBytes [ 7][RX-C] 50.00-60.00 sec 2.73 GBytes 2.35 Gbits/sec - - - - - - - - - - - - - - - - - - - - - - - - - [ ID][Role] Interval Transfer Bitrate Retr [ 5][TX-C] 0.00-60.00 sec 16.4 GBytes 2.35 Gbits/sec 0 sender [ 5][TX-C] 0.00-60.04 sec 16.4 GBytes 2.35 Gbits/sec receiver [ 7][RX-C] 0.00-60.00 sec 16.4 GBytes 2.35 Gbits/sec 1 sender [ 7][RX-C] 0.00-60.04 sec 16.4 GBytes 2.35 Gbits/sec receiver iperf Done. |
Perfect! The maximum speed can be achieved even in full-duplex mode. The bidirectional test completely failed in Windows 11 Pro, so at least we know it’s not a hardware issue since it works perfectly in Linux.
When I first tried WiFi 6 it didn’t look so good:
- Upload:
|
1 2 3 4 5 6 7 8 9 10 11 12 13 14 |
jaufranc@Mini-IT13-CNX:~$ iperf3 -t 60 -c 192.168.31.12 -i 10 Connecting to host 192.168.31.12, port 5201 [ 5] local 192.168.31.122 port 43858 connected to 192.168.31.12 port 5201 [ ID] Interval Transfer Bitrate Retr Cwnd [ 5] 0.00-10.00 sec 27.9 MBytes 23.4 Mbits/sec 62 63.6 KBytes [ 5] 10.00-20.00 sec 28.3 MBytes 23.8 Mbits/sec 21 74.9 KBytes [ 5] 20.00-30.00 sec 28.2 MBytes 23.6 Mbits/sec 34 73.5 KBytes [ 5] 30.00-40.00 sec 27.8 MBytes 23.3 Mbits/sec 46 73.5 KBytes [ 5] 40.00-50.00 sec 28.2 MBytes 23.6 Mbits/sec 51 70.7 KBytes [ 5] 50.00-60.00 sec 28.3 MBytes 23.8 Mbits/sec 26 60.8 KBytes - - - - - - - - - - - - - - - - - - - - - - - - - [ ID] Interval Transfer Bitrate Retr [ 5] 0.00-60.00 sec 169 MBytes 23.6 Mbits/sec 240 sender [ 5] 0.00-60.06 sec 168 MBytes 23.5 Mbits/sec receiver |
But this was done from an SSH terminal and I noticed the the display was turned off, so the system might have been in some low-power mode.
But if I wake up the system and turn on the display then the results are much different…
- Upload:
|
1 2 3 4 5 6 7 8 9 10 11 12 13 14 15 16 |
jaufranc@Mini-IT13-CNX:~$ iperf3 -t 60 -c 192.168.31.12 -i 10 Connecting to host 192.168.31.12, port 5201 [ 5] local 192.168.31.122 port 57028 connected to 192.168.31.12 port 5201 [ ID] Interval Transfer Bitrate Retr Cwnd [ 5] 0.00-10.00 sec 1.40 GBytes 1.20 Gbits/sec 511 1.16 MBytes [ 5] 10.00-20.00 sec 1.54 GBytes 1.32 Gbits/sec 25 1.05 MBytes [ 5] 20.00-30.00 sec 1.38 GBytes 1.19 Gbits/sec 455 1.12 MBytes [ 5] 30.00-40.00 sec 1.36 GBytes 1.17 Gbits/sec 65 771 KBytes [ 5] 40.00-50.00 sec 1.51 GBytes 1.29 Gbits/sec 232 618 KBytes [ 5] 50.00-60.00 sec 1.38 GBytes 1.18 Gbits/sec 215 1.46 MBytes - - - - - - - - - - - - - - - - - - - - - - - - - [ ID] Interval Transfer Bitrate Retr [ 5] 0.00-60.00 sec 8.58 GBytes 1.23 Gbits/sec 1503 sender [ 5] 0.00-60.04 sec 8.58 GBytes 1.23 Gbits/sec receiver iperf Done. |
- Download:
|
1 2 3 4 5 6 7 8 9 10 11 12 13 14 15 16 17 |
jaufranc@Mini-IT13-CNX:~$ iperf3 -t 60 -c 192.168.31.12 -i 10 -R Connecting to host 192.168.31.12, port 5201 Reverse mode, remote host 192.168.31.12 is sending [ 5] local 192.168.31.122 port 59472 connected to 192.168.31.12 port 5201 [ ID] Interval Transfer Bitrate [ 5] 0.00-10.00 sec 1.68 GBytes 1.44 Gbits/sec [ 5] 10.00-20.00 sec 1.19 GBytes 1.02 Gbits/sec [ 5] 20.00-30.00 sec 1.20 GBytes 1.03 Gbits/sec [ 5] 30.00-40.00 sec 1.49 GBytes 1.28 Gbits/sec [ 5] 40.00-50.00 sec 1.14 GBytes 982 Mbits/sec [ 5] 50.00-60.00 sec 1.21 GBytes 1.04 Gbits/sec - - - - - - - - - - - - - - - - - - - - - - - - - [ ID] Interval Transfer Bitrate Retr [ 5] 0.00-60.04 sec 7.91 GBytes 1.13 Gbits/sec 184 sender [ 5] 0.00-60.00 sec 7.91 GBytes 1.13 Gbits/sec receiver iperf Done. |
Again excellent results, and that’s the first platform that can sustain 1 Gbps+ speed with WiFi 6 in our test environment, although the Khadas Mind Premium was close with 1.40 Gbps/ 991 Mbps…
Stress test, CPU temperature, and power limits
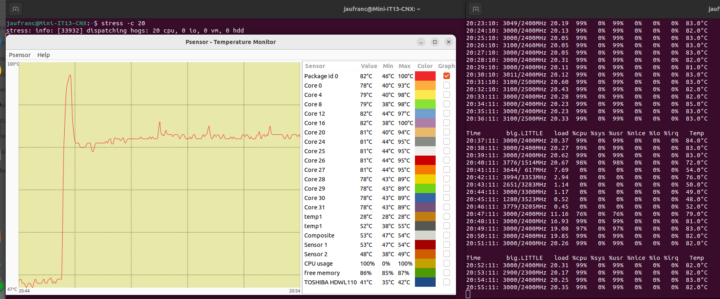
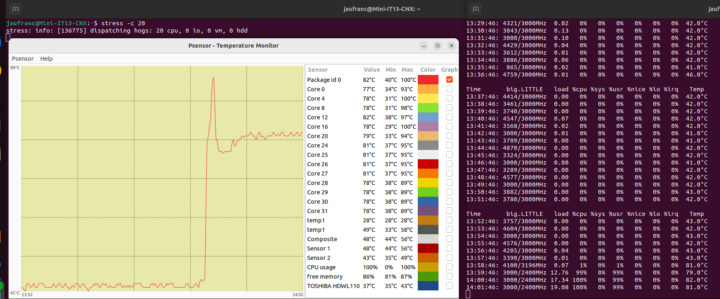
We’ve already run a stress test on all twenty threads of the Core i9-13900H processor while checking out the package temperature and CPU frequencies reported by sbc-bench.sh script.
The chart above illustrates perfectly the behavior of the processor which we’ve seen in both Windows and now Linux. When the stress test starts the temperature jumps to close to 100C very quickly as the processor performs at its best (and draws a lot of power) for a few seconds, before dropping sharply and stabilizing at about 80°C as the CPU core frequencies are lowered to a more sustainable level. We used sbc-bench.sh in review mode and it will update every minute so it did not pick up the top frequencies, but we can see the P-cores are running at 3,000 MHz and the E-cores at 2,400 MHz as the test carries on. I forgot to stop the test overnight and the test ran for over 15 hours, and when I checked it again the system was still at 82°C and the frequencies at 3GHz/2.4GHz.
Let’s try to change PL1 to 45W and see what happens:
|
1 2 3 4 5 6 7 8 9 10 11 12 13 |
jaufranc@Mini-IT13-CNX:/media/sda2$ sudo powercap-set intel-rapl -z 0 -c 0 -l 45000000 jaufranc@Mini-IT13-CNX:/media/sda2$ sudo powercap-info -p intel-rapl enabled: 1 Zone 0 name: package-0 enabled: 1 max_energy_range_uj: 262143328850 energy_uj: 259048924479 Constraint 0 name: long_term power_limit_uw: 45000000 time_window_us: 27983872 max_power_uw: 45000000 |
And what I just did had no effect at all…
That’s odd, so I’m probably doing something wrong although I don’t see any other parameter in powercap-info that could serve as PL1… As a final test, I stopped the stress test, let the system cool down for a bit, and ran GeekBench 6 again…
Those are about the same results before I tried to change the power limit, but obviously what I did had no effect whatsoever…
GEEKOM Mini IT13’s Power Consumption
I used a wall power meter to measure the power consumption of the GEEKOM Mini IT13 with Ubuntu 22.04 using WiFi 6, two RF dongles for a mouse and a keyboard, and CrowView portable monitor connected over HDMI and an external USB power adapter, unless otherwise noted.
Power consumption measurements in Ubuntu 22.04:
- Power off – 1.5 Watts
- Idle
- 7.5 – 7.8 Watts
- CrowView monitor connected via USB-C port – 13.5 – 14.4 Watts (the mini PC also powers the display)
- Video playback – 15.2 – 22.6 Watts (YouTube 4K60fps in Firefox)
- CPU stressed (stress -c 20)
- First few seconds (30 seconds?) – 75 to 77 Watts
- After that – 52.6 – 53.2 Watts
Conclusion
In either Windows 11 Pro or Ubuntu 22.04, GEEKOM Mini IT13 is the most powerful mini PC we’ve reviewed thanks to the Intel Core i9-13900H 14-core Raptor Lake processor that outperforms all other processors except when it comes to 3D graphics where the AMD Ryzen 9 6900HX SoC with Radeon Graphics 680M delivers a higher score in Unigine Heaven 4.0 benchmark. Memory bandwidth is also lower than some other mini PC notably because of the use of DDR4 memory instead of DDR5 memory.
GEEKOM Mini IT13 mini PC works well in Ubuntu 22.04, except for 8K 60 fps YouTube video playback that is unusable, but 4K 60 fps or 8K 30 fps are fine with both Firefox and Chrome which should satisfy most users. YouTube 8K 60 fps worked fine in Windows 11 Pro with Chrome, so that’s one aspect where Windows works better. But Ubuntu 22.04 is quite better for networking with iperf3’s 2.5GbE full-duplex actually going through, and higher upload and download data rates for WiFi 6 with speeds exceeding 1 Gbps. Ubuntu boots really fast on this type of system as within 3 or 4 seconds the login prompt comes up, and applications like GIMP load in less than two seconds.
The main downside is similar to our experience in Windows 11 Pro with the Core i9-13900H being limited by its power limit in such as small device, so the system does not extract all performance from the processor. It should be possible to improve performance (while increasing fan noise) by changing the PL1 power limit as we did in Windows, but changing that limit had no effect in Ubuntu. Fan noise is there, but as noted in the Windows review, it’s not excessive in most cases, except when the system starts to draw close to 80W during short peaks, but after that, the fan noise is not too annoying even in a stress test.
I’d like to thank GEEKOM for sending the Mini IT13 mini PC for review. The company sells the device for $799 on its online store where you can use the coupon code cnxsoftware40 to get a $40 discount, as well as on Amazon with the $40 discount coupon code A2MVLVHK.

Jean-Luc started CNX Software in 2010 as a part-time endeavor, before quitting his job as a software engineering manager, and starting to write daily news, and reviews full time later in 2011.
Support CNX Software! Donate via cryptocurrencies, become a Patron on Patreon, or purchase goods on Amazon or Aliexpress


