I started the NanoPi R5S review with an unboxing, a teardown, a quick try of the pre-installed OpenWrt-based FriendlyWrt, and some iperf3 benchmarks on the 2.5GbE interfaces that were rather disappointing. I test further I switched to the Ubuntu 20.04-based FriendlyCore image since I’m more familiar with Debian-based operating systems, and some tools will not run on OpenWrt. Note the performance is still not quite optimal, and that’s why I call this a preview since numbers should improve in the next few months as more people tweak the software.
OpenWrt optimizations?
But before jumping to Ubuntu, I gave an updated version of FriendlyWrt a try as FriendElec told me they had added some optimizations:
We have made some optimizations on the new image, such as NIC interrupt settings, and offload support…
So I downloaded “rk3568-eflasher-friendlywrt-20220526.img.gz” found on Google Drive, flashed it to a microSD card with USBImager, and booted it to the router.
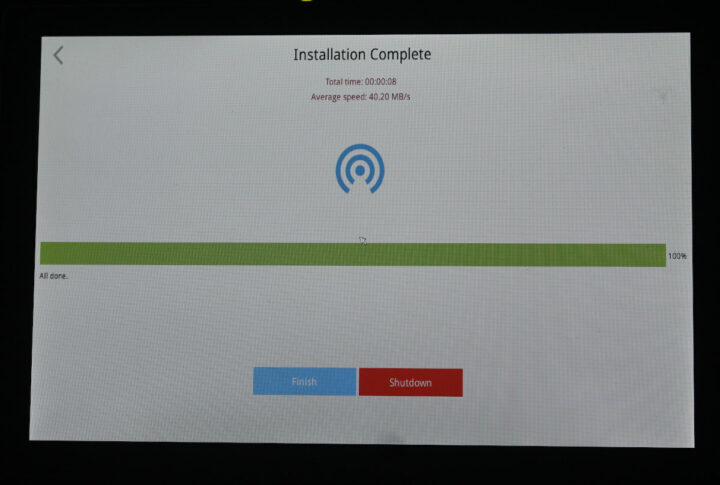
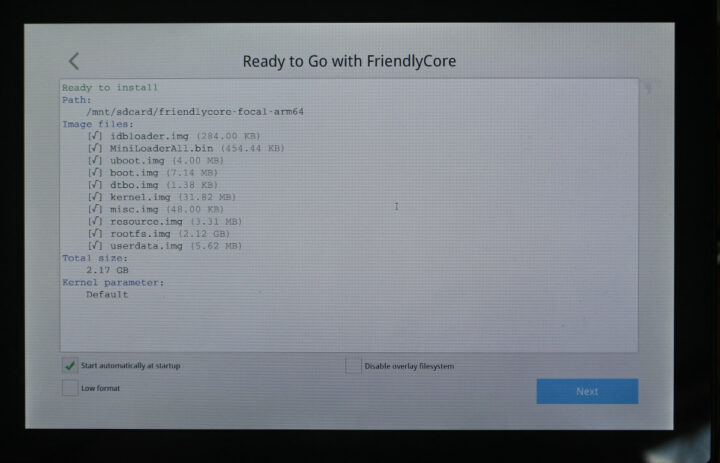
It will automatically flash the image to the eMMC flash, If you connect a monitor you can follow the result. Once it’s done, remove the microSD card, and power cycle the router.
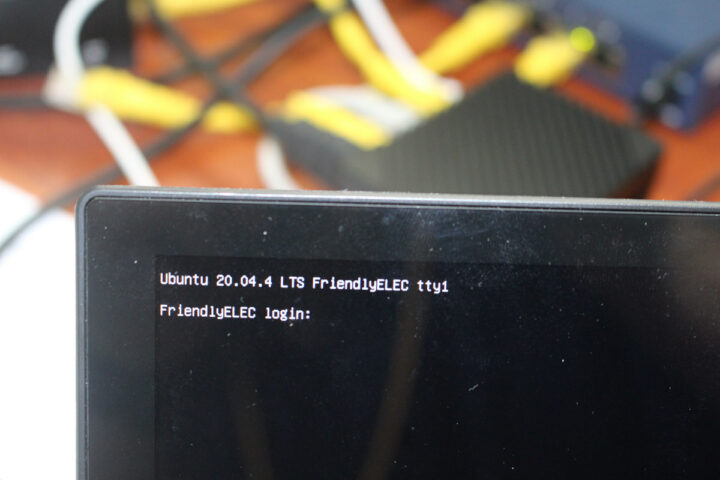
You can check the status by connecting an HDMI monitor (as shown above), or checking out the LEDs on the device. It’s very fast and the installation to the eMMC flash takes only a few seconds.
The main changes were made to the 40-net-smp-affinity file. In the pre-installed FriendlyWrt, it looks like that:
|
1 2 3 4 5 6 7 8 9 10 11 12 13 |
friendlyelec,nanopi-r5s) set_interface_core 8 "eth0" echo 7 > /sys/class/net/eth0/queues/rx-0/rps_cpus set_interface_core 2 "eth1-0" set_interface_core 4 "eth1-16" set_interface_core 4 "eth1-18" echo b > /sys/class/net/eth1/queues/rx-0/rps_cpus set_interface_core 4 "eth2-0" set_interface_core 2 "eth2-16" set_interface_core 2 "eth2-18" echo 9 > /sys/class/net/eth2/queues/rx-0/rps_cpus ;; esac |
While the new 40-net-smp-affinity file is indeed different:
|
1 2 3 4 5 6 7 8 9 10 11 12 13 |
friendlyelec,nanopi-r5s) set_interface_core 8 "eth0" echo f > /sys/class/net/eth0/queues/rx-0/rps_cpus set_interface_core 4 "eth1-0" set_interface_core 4 "eth1-16" set_interface_core 4 "eth1-18" echo b > /sys/class/net/eth1/queues/rx-0/rps_cpus set_interface_core 2 "eth2-0" set_interface_core 2 "eth2-16" set_interface_core 2 "eth2-18" echo d > /sys/class/net/eth2/queues/rx-0/rps_cpus ;; esac |
Willy Tarreau explains the changes made for the eth1 interface:
It involves RPS …. i.e. they receive this IRQ on core 2 and redistribute the incoming traffic to cores 0,1,3. That’s the right way to use RPS. However you have to manually assign iperf and watch the first core that saturates. If it’s saturating core 2 with ksoftirqd first, make sure that iperf runs on any of the other 3. If core2 is slightly idle, try to put iperf on it. If putting it on it makes ksoftirqd pop up, then they’re hindering each other, and you’d rather change the RPS setting to free another core and use it for iperf.
I did try this method before testing and switching to Ubuntu, and my results were even worse with the new FriendlyWrt image:
|
1 2 3 4 5 6 7 8 9 10 11 12 13 14 15 16 17 18 19 20 21 22 23 24 25 26 27 28 29 30 31 32 33 34 |
$ iperf3 -t 60 -c 192.168.2.1 -i 10 Connecting to host 192.168.2.1, port 5201 [ 5] local 192.168.2.130 port 49590 connected to 192.168.2.1 port 5201 [ ID] Interval Transfer Bitrate Retr Cwnd [ 5] 0.00-10.00 sec 1.92 GBytes 1.65 Gbits/sec 0 1.62 MBytes [ 5] 10.00-20.00 sec 1.91 GBytes 1.64 Gbits/sec 10 2.34 MBytes [ 5] 20.00-30.00 sec 1.90 GBytes 1.63 Gbits/sec 0 2.61 MBytes [ 5] 30.00-40.00 sec 1.85 GBytes 1.59 Gbits/sec 4 1.30 MBytes [ 5] 40.00-50.00 sec 1.88 GBytes 1.61 Gbits/sec 1 1.06 MBytes [ 5] 50.00-60.00 sec 1.76 GBytes 1.51 Gbits/sec 2 868 KBytes - - - - - - - - - - - - - - - - - - - - - - - - - [ ID] Interval Transfer Bitrate Retr [ 5] 0.00-60.00 sec 11.2 GBytes 1.61 Gbits/sec 17 sender [ 5] 0.00-60.05 sec 11.2 GBytes 1.60 Gbits/sec receiver iperf Done. $ iperf3 -t 60 -c 192.168.2.1 -i 10 -R Connecting to host 192.168.2.1, port 5201 Reverse mode, remote host 192.168.2.1 is sending [ 5] local 192.168.2.130 port 49594 connected to 192.168.2.1 port 5201 [ ID] Interval Transfer Bitrate [ 5] 0.00-10.00 sec 1.22 GBytes 1.05 Gbits/sec [ 5] 10.00-20.00 sec 1.36 GBytes 1.17 Gbits/sec [ 5] 20.00-30.00 sec 1.31 GBytes 1.12 Gbits/sec [ 5] 30.00-40.00 sec 1.46 GBytes 1.26 Gbits/sec [ 5] 40.00-50.00 sec 1.47 GBytes 1.26 Gbits/sec [ 5] 50.00-60.00 sec 1.46 GBytes 1.26 Gbits/sec - - - - - - - - - - - - - - - - - - - - - - - - - [ ID] Interval Transfer Bitrate Retr [ 5] 0.00-60.05 sec 8.29 GBytes 1.19 Gbits/sec 1 sender [ 5] 0.00-60.00 sec 8.29 GBytes 1.19 Gbits/sec receiver iperf Done. |
So this would have to be revisited.
M.2 NVMe SSD installation in NanoPi R5S
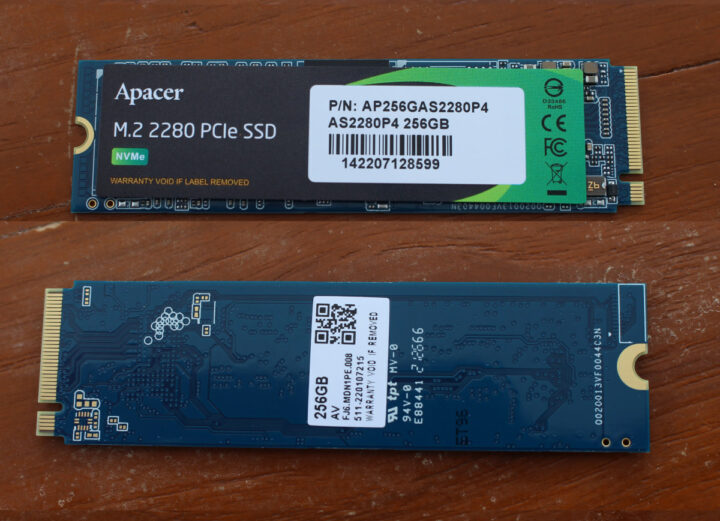
I’ve just purchased an APACER AS2280 (AP256GAS2280P4-1) PCIe Gen 3.0 x4 SSD that can achieve up to 1,800 MB/s sequential read and up to 1,100 MB/s sequential write speeds on the right hardware.
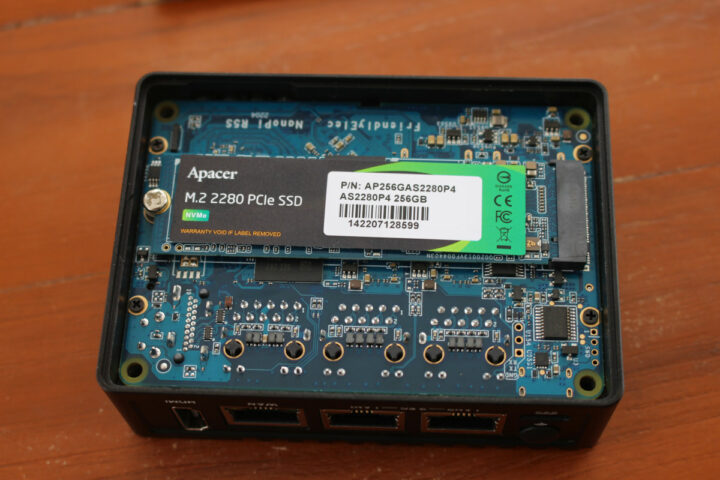
The installation is straightforward as I just had to loosen four screws to remove the bottom cover, install the SSD, and fasten it with the provided screw.
Installing Ubuntu 20.04 FriendlyCore on NanoPi R5S
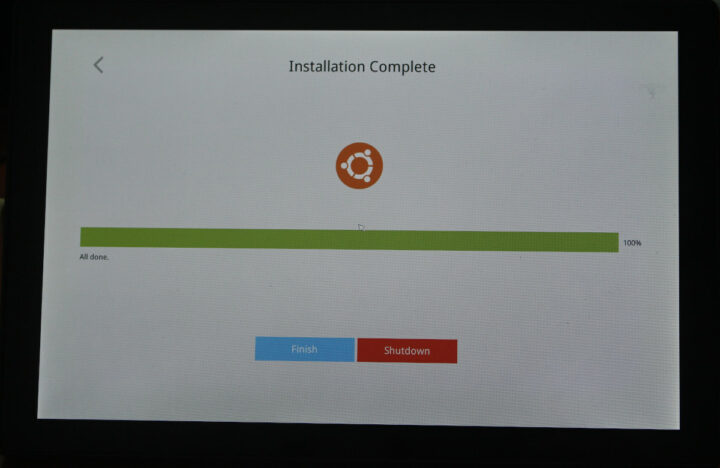
I first attempted to install FriendlyCore using the eflasher image.
It looked good, so I restarted the router, but then I noticed the WAN interface link would not show on the TP-Link switch, and only the power LED was turned on (It happens the latter is normal for the FriendlyCore/Ubuntu image). I tried again, going into eflasher UI settings by clicking on Finish, but still no luck.
So instead I downloaded the “SD” image to boot directly from the microSD card and run the OS from there. It works fine. If you intend to use NanoPi R5S for multiple purposes and expected a desktop environment in the Ubuntu 20.04 image, you’ll be disappointed, as the HDMI output is currently only used to access the terminal.
FriendlyCore system information
You’ll find the boot log on CNX Software Pastebin. I logged in with SSH using pi/pi credentials (username/password), and upgraded the system to the latest packages with:
|
1 2 |
sudo apt update sudo apt dist-upgrade |
Let’s run some commands to get system information:
|
1 2 3 4 5 6 7 8 9 10 11 12 13 14 15 16 17 18 19 20 |
pi@FriendlyELEC:~$ cat /etc/lsb-release DISTRIB_ID=Ubuntu DISTRIB_RELEASE=20.04 DISTRIB_CODENAME=focal DISTRIB_DESCRIPTION="Ubuntu 20.04.4 LTS" pi@FriendlyELEC:~$ uname -a Linux FriendlyELEC 5.10.66 #219 SMP PREEMPT Fri Apr 22 18:20:21 CST 2022 aarch64 aarch64 aarch64 GNU/Linux pi@FriendlyELEC:~$ free -mh total used free shared buff/cache available Mem: 1.9Gi 150Mi 1.7Gi 3.0Mi 114Mi 1.7Gi Swap: 0B 0B 0B pi@FriendlyELEC:~$ df -mh Filesystem Size Used Avail Use% Mounted on udev 969M 0 969M 0% /dev tmpfs 197M 480K 196M 1% /run overlay 27G 1013M 26G 4% / tmpfs 981M 0 981M 0% /dev/shm tmpfs 5.0M 4.0K 5.0M 1% /run/lock tmpfs 981M 0 981M 0% /sys/fs/cgroup tmpfs 197M 0 197M 0% /run/user/1000 |
It looks all good, except the NVMe drive has not been mounted automatically. Let’s find more details with inxi:
|
1 2 3 4 5 6 7 8 9 10 11 12 13 14 15 16 17 18 19 20 21 22 23 24 25 26 27 28 29 30 31 32 33 34 35 36 37 38 39 40 41 42 43 44 45 46 47 48 |
pi@FriendlyELEC:~$ inxi -Fc0 System: Host: FriendlyELEC Kernel: 5.10.66 aarch64 bits: 64 Console: tty 0 Distro: Ubuntu 20.04.4 LTS (Focal Fossa) Machine: Type: ARM Device System: FriendlyElec NanoPi R5S details: N/A serial: 8cbfe79e107c459c Battery: ID-1: test_battery charge: 100% condition: N/A CPU: Topology: Quad Core model: N/A variant: cortex-a55 bits: 64 type: MCP Speed: 408 MHz min/max: 408/1992 MHz Core speeds (MHz): 1: 1992 2: 1992 3: 1992 4: 1992 Graphics: Device-1: display-subsystem driver: rockchip_drm v: N/A Device-2: mali-bifrost driver: mali v: N/A Device-3: rk3568-dw-hdmi driver: dwhdmi_rockchip v: N/A Display: server: X.org 1.20.8 driver: dwhdmi_rockchip tty: 80x24 Message: Advanced graphics data unavailable in console. Try -G --display Audio: Device-1: rk3568-dw-hdmi driver: dwhdmi_rockchip Device-2: simple-audio-card driver: asoc_simple_card Device-3: simple-audio-card driver: N/A Device-4: simple-audio-card driver: asoc_simple_card Sound Server: ALSA v: k5.10.66 Network: Device-1: Realtek RTL8125 2.5GbE driver: r8125 IF: eth1 state: down mac: e2:1d:62:a1:1a:ca Device-2: Realtek RTL8125 2.5GbE driver: r8125 IF: eth1 state: down mac: e2:1d:62:a1:1a:ca Device-3: rk3568-gmac driver: rk_gmac_dwmac IF-ID-1: eth0 state: up speed: 1000 Mbps duplex: full mac: de:1d:62:a1:1a:ca IF-ID-2: eth2 state: down mac: 12:bf:2b:d6:4b:e0 Drives: Local Storage: total: 274.88 GiB used: 1012.3 MiB (0.4%) ID-1: /dev/mmcblk0 model: SD16G size: 29.12 GiB ID-2: /dev/mmcblk2 model: 8GTF4R size: 7.28 GiB ID-3: /dev/nvme0n1 vendor: Apacer model: AS2280P4 256GB size: 238.47 GiB Partition: ID-1: / size: 26.48 GiB used: 1012.3 MiB (3.7%) fs: overlay source: ERR-102 Sensors: System Temperatures: cpu: 46.1 C mobo: N/A Fan Speeds (RPM): N/A Info: Processes: 130 Uptime: 7m Memory: 1.92 GiB used: 211.4 MiB (10.8%) Init: systemd Shell: bash inxi: 3.0.38 |
Only eth0 WAN port is up, and eth1/eth2 2.5GbE ports are down, and not configured at all. FriendlyElec appears to mostly focus on the FriendlyWrt image, and they told me optimizations were not implemented on FriendlyCore yet, so most people should probably use FriendlyWrt instead since it will be easier to configure the network and router settings. I can see the Apacer AS2280P4 SSD is detected, and it turns out it’s not formatted out of the box, so I just formatted it with mkfs.ext4.
Benchmarking NanoPi R5S
Let’s run SBC Bench on the router to benchmark the CPU and potentially find some issues:
|
1 2 3 4 5 6 7 8 9 10 11 12 13 14 15 16 17 18 19 20 21 22 23 24 25 26 27 28 29 30 31 32 33 34 35 36 37 38 39 40 41 42 43 44 45 46 47 |
$ sudo /bin/bash ./sbc-bench.sh -c [sudo] password for pi: WARNING: dmesg output does not contain early boot messages which help in identifying hardware details. It is recommended to reboot now and then execute the benchmarks. Press [ctrl]-[c] to stop or [enter] to continue. Average load and/or CPU utilization too high (too much background activity). Waiting... Too busy for benchmarking: 07:21:06 up 3 min, 1 user, load average: 0.41, 0.27, 0.11, cpu: 3% Too busy for benchmarking: 07:21:11 up 3 min, 1 user, load average: 0.38, 0.26, 0.11, cpu: 1% Too busy for benchmarking: 07:21:16 up 3 min, 1 user, load average: 0.35, 0.26, 0.11, cpu: 1% Too busy for benchmarking: 07:21:21 up 3 min, 1 user, load average: 0.32, 0.25, 0.11, cpu: 1% Too busy for benchmarking: 07:21:26 up 3 min, 1 user, load average: 0.29, 0.25, 0.11, cpu: 1% Too busy for benchmarking: 07:21:31 up 3 min, 1 user, load average: 0.27, 0.24, 0.10, cpu: 1% sbc-bench v0.9.7 Installing needed tools. This may take some time. Done. Checking cpufreq OPP. Done (results will be available in 20-28 minutes). Executing tinymembench. Done. Executing RAM latency tester. Done. Executing OpenSSL benchmark. Done. Executing 7-zip benchmark. Done. Executing cpuminer. 5 more minutes to wait. Done. Checking cpufreq OPP. Done (23 minutes elapsed). Memory performance: memcpy: 2800.5 MB/s memset: 6191.5 MB/s (0.2%) Cpuminer total scores (5 minutes execution): 6.87,6.86,6.85,6.84,6.83,6.82,6.79 kH/s 7-zip total scores (3 consecutive runs): 4756,4768,4727 OpenSSL results: type 16 bytes 64 bytes 256 bytes 1024 bytes 8192 bytes 16384 bytes aes-128-cbc 173609.37k 509936.75k 972013.31k 1264387.07k 1383497.73k 1392645.46k aes-128-cbc 175451.26k 506569.66k 973690.71k 1264628.74k 1382845.10k 1393180.67k aes-192-cbc 166539.51k 448796.48k 790104.58k 970846.55k 1040621.57k 1046462.46k aes-192-cbc 168407.31k 451709.25k 792148.91k 970579.63k 1041061.21k 1046375.08k aes-256-cbc 159430.38k 412822.74k 676804.10k 809129.64k 857347.41k 861137.58k aes-256-cbc 162313.43k 412763.39k 677746.94k 809317.38k 857642.33k 861334.19k Unable to upload full test results. Please copy&paste the below stuff to pastebin.com and provide the URL. Check the output for throttling and swapping please. |
I launched this almost immediately after boot, so the dmesg output should be there in full (see boot load earlier in this preview/review), but the script is missing some information from it. The full output from sbc-bench.sh script can be found on pastebin, and we can notably see the “1992” MHz advertised frequency is tested to be 1845 MHz in reality, so some optimization may be possible here.
7zip is still faster than on NanoPi R2S router (3871), or about a 23% boost in performance, while AES-256-CBC 16KB is about 22% faster (704,872.45 vs 861,334.19kH/s)
NVMe benchmarking
I tested the NVMe SSD three times with iozone 3 three times, one with 100MB file:
|
1 2 3 4 5 6 7 8 9 10 11 12 13 14 15 16 17 18 19 20 21 22 23 24 25 26 27 28 29 30 |
pi@FriendlyELEC:/media/nvme0n1$ sudo iozone -e -I -a -s 100M -r 4k -r 16k -r 512k -r 1024k -r 16384k -i 0 -i 1 -i 2 Iozone: Performance Test of File I/O Version $Revision: 3.489 $ Compiled for 64 bit mode. Build: linux Include fsync in write timing O_DIRECT feature enabled Auto Mode File size set to 102400 kB Record Size 4 kB Record Size 16 kB Record Size 512 kB Record Size 1024 kB Record Size 16384 kB Command line used: iozone -e -I -a -s 100M -r 4k -r 16k -r 512k -r 1024k -r 16384k -i 0 -i 1 -i 2 Output is in kBytes/sec Time Resolution = 0.000001 seconds. Processor cache size set to 1024 kBytes. Processor cache line size set to 32 bytes. File stride size set to 17 * record size. random random bkwd record stride kB reclen write rewrite read reread read write read rewrite read fwrite frewrite fread freread 102400 4 34994 53668 30431 30385 30136 59719 102400 16 102031 130543 80174 80125 79796 133162 102400 512 300692 296328 276975 291837 276681 313464 102400 1024 309822 340026 308900 326826 306102 339059 102400 16384 357975 392544 369753 391219 370336 390004 iozone test complete. |
then a 500MB file:
|
1 2 3 4 5 6 7 8 |
pi@FriendlyELEC:/media/nvme0n1$ sudo iozone -e -I -a -s 500M -r 4k -r 16k -r 512k -r 1024k -r 16384k -i 0 -i 1 -i 2 random random bkwd record stride kB reclen write rewrite read reread read write read rewrite read fwrite frewrite fread freread 512000 4 35308 62195 30436 30380 30251 61600 512000 16 101504 134916 80454 80449 79642 133631 512000 512 293784 308843 284081 284902 281025 306749 512000 1024 326784 333909 318075 321837 315874 333259 512000 16384 378436 383013 381319 383621 382224 381967 |
and finally a 1GB file:
|
1 2 3 4 5 6 7 8 |
pi@FriendlyELEC:/media/nvme0n1$ sudo iozone -e -I -a -s 1000M -r 4k -r 16k -r 512k -r 1024k -r 16384k -i 0 -i 1 -i 2 random random bkwd record stride kB reclen write rewrite read reread read write read rewrite read fwrite frewrite fread freread 1024000 4 35105 58082 30395 30447 27458 60895 1024000 16 102421 135279 80210 80314 74596 133579 1024000 512 300759 314704 282743 283883 277911 313413 1024000 1024 329840 337468 318228 319091 317641 337714 1024000 16384 383289 385247 382642 382850 382870 381344 |
The results are more or less consistent across all three tests without massive variations, and in last we’ve got about 380MB/s for read and write, well below the SSD advertised write/read speeds, and results for ODROID-M1, but that’s because of the PCIe 2.0 x1 interface used in this design, instead of the PCIe Gen 3.0 x2 interface used in the Hardkernel board.
Here’s lspci output for reference:
|
1 2 3 4 5 6 7 8 9 10 11 12 13 14 15 |
pi@FriendlyELEC:/media/nvme0n1$ sudo lspci -v 0002:21:00.0 Non-Volatile memory controller: Phison Electronics Corporation Device 5013 (rev 01) (prog-if 02 [NVM Express]) Subsystem: Phison Electronics Corporation Device 5013 Flags: bus master, fast devsel, latency 0, IRQ 87 Memory at 380900000 (64-bit, non-prefetchable) [size=16K] Capabilities: [80] Express Endpoint, MSI 00 Capabilities: [d0] MSI-X: Enable+ Count=9 Masked- Capabilities: [e0] MSI: Enable- Count=1/8 Maskable+ 64bit+ Capabilities: [f8] Power Management version 3 Capabilities: [100] Latency Tolerance Reporting Capabilities: [110] L1 PM Substates Capabilities: [200] Advanced Error Reporting Capabilities: [300] Secondary PCI Express Kernel driver in use: nvme |
2.5GbE interfaces configuration and benchmarking
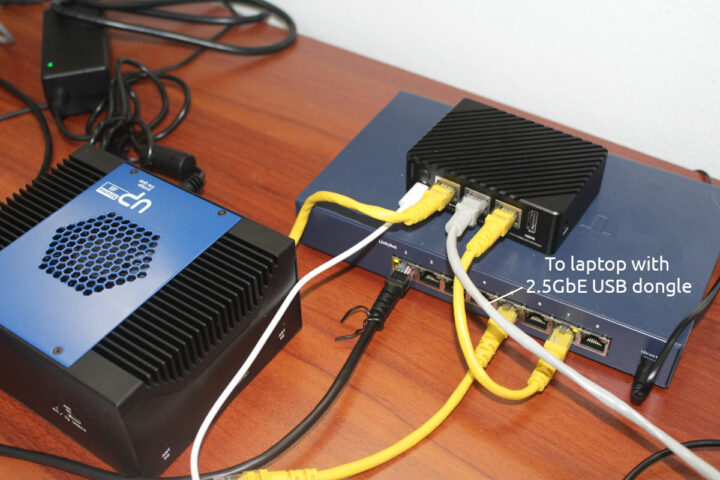
Since only the eth0 Gigabit Ethernet “WAN” interface is configured out of the box, we have to configure the two 2.5GbE ports manually. I used the same testbed as in the first part of the review with FriendlyWrt, namely a Ubuntu 20.04 laptop with a Realtek RTL8156BG USB 3.0 to 2.5GbE dongle connected to eth1, and UP Xtreme i11 mini PC connected to eth2. Instead of using a bridge interface like in FriendlyWrt, I’ll configure two different subnets: 192.168.2.0 for eth1, and 192.168.3.0 for eth2.
Let’s create two new files in /etc/network/interfaces.d/:
- eth1
|
1 2 3 4 5 6 |
auto eth1 iface eth1 inet static address 192.168.2.1 network 192.168.2.0 netmask 255.255.255.0 broadcast 192.168.2.255 |
- eth2
|
1 2 3 4 5 6 |
auto eth2 iface eth2 inet static address 192.168.3.1 network 192.168.3.0 netmask 255.255.255.0 broadcast 192.168.3.255 |
Restart the network as follows:
|
1 |
sudo systemctl restart networking |
Now install a DHCP server
|
1 |
sudo apt install isc-dhcp-server |
edit /etc/dhcp/dhcpd.conf file with our two subnets:
|
1 2 3 4 5 6 7 8 9 |
subnet 192.168.2.0 netmask 255.255.255.0 { range 192.168.2.100 192.168.2.200; option routers 192.168.2.1; } subnet 192.168.3.0 netmask 255.255.255.0 { range 192.168.3.100 192.168.3.200; option routers 192.168.3.1; } |
… before restarting the dhcp server:
|
1 |
sudo systemctl restart isc-dhcp-server |
At this point the laptop and mini PC should get their IP address from NanoPi R5S on the respective subnets. We can start benchmarking the interfaces:
iperf3 download (Rx from R5S point-of-view) using eth1 connected to the laptop:
|
1 2 3 4 5 6 7 8 9 10 11 12 13 14 15 16 |
$ iperf3 -t 60 -c 192.168.2.1 -i 10 Connecting to host 192.168.2.1, port 5201 [ 5] local 192.168.2.130 port 59822 connected to 192.168.2.1 port 5201 [ ID] Interval Transfer Bitrate Retr Cwnd [ 5] 0.00-10.00 sec 2.28 GBytes 1.96 Gbits/sec 42 1.41 MBytes [ 5] 10.00-20.00 sec 2.02 GBytes 1.74 Gbits/sec 0 1.61 MBytes [ 5] 20.00-30.00 sec 1.72 GBytes 1.48 Gbits/sec 0 1.62 MBytes [ 5] 30.00-40.00 sec 1.87 GBytes 1.61 Gbits/sec 0 1.62 MBytes [ 5] 40.00-50.00 sec 1.89 GBytes 1.62 Gbits/sec 0 1.70 MBytes [ 5] 50.00-60.00 sec 2.06 GBytes 1.77 Gbits/sec 21 1.66 MBytes - - - - - - - - - - - - - - - - - - - - - - - - - [ ID] Interval Transfer Bitrate Retr [ 5] 0.00-60.00 sec 11.8 GBytes 1.70 Gbits/sec 63 sender [ 5] 0.00-60.04 sec 11.8 GBytes 1.69 Gbits/sec receiver iperf Done. |
That’s a bit slower than what I got (1.85 Gbps) in OpenWrt, and there are retransmissions. I also monitored the system with sbc-bench.sh during the transfer:
|
1 2 3 4 5 6 7 8 9 10 11 12 13 14 15 16 17 18 19 20 21 22 23 24 25 26 |
pi@FriendlyELEC:~$ sudo ./sbc-bench.sh -m Rockchip RK3568 (35682000), Kernel: aarch64, Userland: arm64 CPU sysfs topology (clusters, cpufreq members, clockspeeds) cpufreq min max CPU cluster policy speed speed core type 0 0 0 408 1992 Cortex-A55 / r2p0 1 0 0 408 1992 Cortex-A55 / r2p0 2 0 0 408 1992 Cortex-A55 / r2p0 3 0 0 408 1992 Cortex-A55 / r2p0 Thermal source: /sys/devices/virtual/thermal/thermal_zone0/ (soc-thermal) Time CPU load %cpu %sys %usr %nice %io %irq Temp 03:38:07: 1416MHz 0.32 5% 3% 1% 0% 0% 0% 55.0°C 03:38:12: 1992MHz 0.37 35% 15% 0% 0% 0% 20% 56.7°C 03:38:17: 1992MHz 0.42 43% 18% 0% 0% 0% 24% 58.3°C 03:38:23: 1992MHz 0.47 42% 17% 0% 0% 0% 23% 57.2°C 03:38:28: 1992MHz 0.51 29% 10% 0% 0% 0% 18% 56.7°C 03:38:33: 1992MHz 0.55 29% 10% 0% 0% 0% 18% 57.2°C 03:38:38: 1992MHz 0.59 26% 8% 0% 0% 0% 17% 56.7°C 03:38:43: 1992MHz 0.62 33% 12% 0% 0% 0% 20% 57.2°C 03:38:48: 1992MHz 0.65 30% 11% 0% 0% 0% 18% 57.2°C 03:38:53: 1992MHz 0.68 26% 7% 0% 0% 0% 17% 57.2°C 03:38:58: 1992MHz 0.79 37% 15% 0% 0% 0% 21% 57.2°C 03:39:03: 1992MHz 0.80 34% 13% 0% 0% 0% 20% 57.2°C 03:39:09: 1104MHz 0.82 34% 14% 0% 0% 0% 19% 55.0°C |
The system performs at its maximum advertised frequency during the test, and I don’t any obvious bottleneck shere.
We can also check some information and stats with ethtool:
|
1 2 3 4 5 6 7 8 9 10 11 12 13 14 15 16 17 18 19 20 21 22 23 24 25 26 27 28 29 30 31 32 33 34 35 36 37 38 39 40 41 42 43 44 45 46 47 48 49 50 51 52 |
pi@FriendlyELEC:~$ sudo ethtool -i eth1 driver: r8125 version: 9.008.00-NAPI firmware-version: expansion-rom-version: bus-info: 0000:01:00.0 supports-statistics: yes supports-test: no supports-eeprom-access: no supports-register-dump: yes supports-priv-flags: no pi@FriendlyELEC:~$ sudo ethtool -S eth1 NIC statistics: tx_packets: 451228 rx_packets: 9569147 tx_errors: 0 rx_errors: 0 rx_missed: 0 align_errors: 0 tx_single_collisions: 0 tx_multi_collisions: 0 unicast: 9569102 broadcast: 45 multicast: 0 tx_aborted: 0 tx_underrun: 0 tx_octets: 31676089 rx_octets: 14506385933 rx_multicast64: 0 tx_unicast64: 451214 tx_broadcast64: 2 tx_multicast64: 12 tx_pause_on: 570 tx_pause_off: 570 tx_pause_all: 1140 tx_deferred: 0 tx_late_collision: 0 tx_all_collision: 0 tx_aborted32: 0 align_errors32: 0 rx_frame_too_long: 0 rx_runt: 0 rx_pause_on: 0 rx_pause_off: 0 rx_pause_all: 0 rx_unknown_opcode: 0 rx_mac_error: 0 tx_underrun32: 0 rx_mac_missed: 31 rx_tcam_dropped: 0 tdu: 0 rdu: 570 |
We did get some rx_mac_missed.
Let’s do that in reverse (Tx):
|
1 2 3 4 5 6 7 8 9 10 11 12 13 14 15 16 17 |
$ iperf3 -t 60 -c 192.168.2.1 -i 10 -R Connecting to host 192.168.2.1, port 5201 Reverse mode, remote host 192.168.2.1 is sending [ 5] local 192.168.2.130 port 59826 connected to 192.168.2.1 port 5201 [ ID] Interval Transfer Bitrate [ 5] 0.00-10.00 sec 1.75 GBytes 1.50 Gbits/sec [ 5] 10.00-20.00 sec 1.95 GBytes 1.67 Gbits/sec [ 5] 20.00-30.00 sec 1.95 GBytes 1.67 Gbits/sec [ 5] 30.00-40.00 sec 1.95 GBytes 1.67 Gbits/sec [ 5] 40.00-50.00 sec 1.94 GBytes 1.67 Gbits/sec [ 5] 50.00-60.00 sec 1.94 GBytes 1.67 Gbits/sec - - - - - - - - - - - - - - - - - - - - - - - - - [ ID] Interval Transfer Bitrate Retr [ 5] 0.00-60.04 sec 11.5 GBytes 1.64 Gbits/sec 0 sender [ 5] 0.00-60.00 sec 11.5 GBytes 1.64 Gbits/sec receiver iperf Done. |
It looks quite better than in OpenWrt (1.12 Gbps).
|
1 2 3 4 5 6 7 8 9 10 11 12 13 14 15 16 17 18 19 20 21 22 23 24 25 26 |
pi@FriendlyELEC:~$ sudo ./sbc-bench.sh -m Rockchip RK3568 (35682000), Kernel: aarch64, Userland: arm64 CPU sysfs topology (clusters, cpufreq members, clockspeeds) cpufreq min max CPU cluster policy speed speed core type 0 0 0 408 1992 Cortex-A55 / r2p0 1 0 0 408 1992 Cortex-A55 / r2p0 2 0 0 408 1992 Cortex-A55 / r2p0 3 0 0 408 1992 Cortex-A55 / r2p0 Thermal source: /sys/devices/virtual/thermal/thermal_zone0/ (soc-thermal) Time CPU load %cpu %sys %usr %nice %io %irq Temp 03:56:48: 1416MHz 0.00 2% 1% 0% 0% 0% 1% 55.0°C 03:56:53: 1992MHz 0.00 23% 17% 0% 0% 0% 4% 57.2°C 03:56:58: 1992MHz 0.30 31% 27% 0% 0% 0% 3% 57.2°C 03:57:03: 1992MHz 0.36 31% 27% 0% 0% 0% 3% 57.8°C 03:57:08: 1992MHz 0.41 31% 27% 0% 0% 0% 3% 57.8°C 03:57:13: 1992MHz 0.46 31% 27% 0% 0% 0% 3% 57.8°C 03:57:19: 1992MHz 0.50 31% 27% 0% 0% 0% 3% 57.8°C 03:57:24: 1992MHz 0.62 31% 27% 0% 0% 0% 3% 57.8°C 03:57:29: 1992MHz 0.65 31% 28% 0% 0% 0% 2% 58.3°C 03:57:34: 1992MHz 0.68 31% 27% 0% 0% 0% 2% 58.3°C 03:57:39: 1992MHz 0.71 31% 27% 0% 0% 0% 2% 57.8°C 03:57:44: 1992MHz 0.73 31% 28% 0% 0% 0% 3% 58.3°C 03:57:49: 1104MHz 0.75 26% 22% 0% 0% 0% 3% 55.0°C |
IRQ percentages are much lower but I suppose that’s normal for Tx.
Let’s switch to eth2 connected to UP Xtreme i11:
|
1 2 3 4 5 6 7 8 9 10 11 12 13 14 15 16 |
devkit@UPX-i11:~$ iperf3 -t 60 -c 192.168.3.1 -i10 Connecting to host 192.168.3.1, port 5201 [ 5] local 192.168.3.100 port 37794 connected to 192.168.3.1 port 5201 [ ID] Interval Transfer Bitrate Retr Cwnd [ 5] 0.00-10.00 sec 2.73 GBytes 2.35 Gbits/sec 0 1.81 MBytes [ 5] 10.00-20.00 sec 2.73 GBytes 2.35 Gbits/sec 0 1.81 MBytes [ 5] 20.00-30.00 sec 2.73 GBytes 2.35 Gbits/sec 0 1.81 MBytes [ 5] 30.00-40.00 sec 2.73 GBytes 2.34 Gbits/sec 0 2.90 MBytes [ 5] 40.00-50.00 sec 2.73 GBytes 2.35 Gbits/sec 0 4.37 MBytes [ 5] 50.00-60.00 sec 2.73 GBytes 2.35 Gbits/sec 0 4.37 MBytes - - - - - - - - - - - - - - - - - - - - - - - - - [ ID] Interval Transfer Bitrate Retr [ 5] 0.00-60.00 sec 16.4 GBytes 2.35 Gbits/sec 0 sender [ 5] 0.00-60.00 sec 16.4 GBytes 2.35 Gbits/sec receiver iperf Done. |
Oh great! It’s the first time I get a decent 2.35 Gbps transfer, so there’s hope!
|
1 2 3 4 5 6 7 8 9 10 11 12 13 14 15 16 17 18 19 20 21 22 23 24 25 26 |
pi@FriendlyELEC:~$ sudo ./sbc-bench.sh -m Rockchip RK3568 (35682000), Kernel: aarch64, Userland: arm64 CPU sysfs topology (clusters, cpufreq members, clockspeeds) cpufreq min max CPU cluster policy speed speed core type 0 0 0 408 1992 Cortex-A55 / r2p0 1 0 0 408 1992 Cortex-A55 / r2p0 2 0 0 408 1992 Cortex-A55 / r2p0 3 0 0 408 1992 Cortex-A55 / r2p0 Thermal source: /sys/devices/virtual/thermal/thermal_zone0/ (soc-thermal) Time CPU load %cpu %sys %usr %nice %io %irq Temp 04:11:00: 1104MHz 0.00 2% 1% 0% 0% 0% 0% 53.8°C 04:11:05: 1992MHz 0.08 34% 12% 0% 0% 0% 21% 56.1°C 04:11:10: 1992MHz 0.23 40% 14% 0% 0% 0% 25% 56.1°C 04:11:15: 1992MHz 0.30 40% 15% 0% 0% 0% 25% 57.2°C 04:11:20: 1992MHz 0.43 40% 14% 0% 0% 0% 25% 57.2°C 04:11:25: 1992MHz 0.48 41% 15% 0% 0% 0% 25% 56.7°C 04:11:30: 1992MHz 0.60 40% 15% 0% 0% 0% 25% 57.2°C 04:11:36: 1992MHz 0.71 40% 14% 0% 0% 0% 25% 57.2°C 04:11:41: 1992MHz 0.74 41% 15% 0% 0% 0% 25% 57.2°C 04:11:46: 1992MHz 0.84 40% 14% 0% 0% 0% 25% 56.7°C 04:11:51: 1992MHz 0.85 40% 14% 0% 0% 0% 25% 57.2°C 04:11:56: 1992MHz 0.86 40% 14% 0% 0% 0% 25% 56.7°C 04:12:01: 1416MHz 0.87 35% 13% 0% 0% 0% 21% 53.8°C |
Unless I’m mistaken the 25% of IRQ should mean a core is fully utilized handling those.
Let’s try Tx:
|
1 2 3 4 5 6 7 8 9 10 11 12 13 14 15 16 17 |
devkit@UPX-i11:~$ iperf3 -t 60 -c 192.168.3.1 -i 10 -R Connecting to host 192.168.3.1, port 5201 Reverse mode, remote host 192.168.3.1 is sending [ 5] local 192.168.3.100 port 37800 connected to 192.168.3.1 port 5201 [ ID] Interval Transfer Bitrate [ 5] 0.00-10.00 sec 1.92 GBytes 1.65 Gbits/sec [ 5] 10.00-20.00 sec 1.84 GBytes 1.58 Gbits/sec [ 5] 20.00-30.00 sec 1.84 GBytes 1.58 Gbits/sec [ 5] 30.00-40.00 sec 1.84 GBytes 1.58 Gbits/sec [ 5] 40.00-50.00 sec 1.84 GBytes 1.58 Gbits/sec [ 5] 50.00-60.00 sec 1.84 GBytes 1.58 Gbits/sec - - - - - - - - - - - - - - - - - - - - - - - - - [ ID] Interval Transfer Bitrate Retr [ 5] 0.00-60.01 sec 11.1 GBytes 1.59 Gbits/sec 0 sender [ 5] 0.00-60.00 sec 11.1 GBytes 1.59 Gbits/sec receiver iperf Done. |
1.59 Gbps. Not quite perfect, but still better than in OpenWrt.
|
1 2 3 4 5 6 7 8 9 10 11 12 13 14 15 16 17 18 19 20 21 22 23 24 25 26 27 |
pi@FriendlyELEC:~$ sudo ./sbc-bench.sh -m Rockchip RK3568 (35682000), Kernel: aarch64, Userland: arm64 CPU sysfs topology (clusters, cpufreq members, clockspeeds) cpufreq min max CPU cluster policy speed speed core type 0 0 0 408 1992 Cortex-A55 / r2p0 1 0 0 408 1992 Cortex-A55 / r2p0 2 0 0 408 1992 Cortex-A55 / r2p0 3 0 0 408 1992 Cortex-A55 / r2p0 Thermal source: /sys/devices/virtual/thermal/thermal_zone0/ (soc-thermal) Time CPU load %cpu %sys %usr %nice %io %irq Temp 04:13:37: 1104MHz 0.31 3% 1% 0% 0% 0% 1% 53.8°C 04:13:42: 1992MHz 0.37 25% 22% 0% 0% 0% 3% 56.1°C 04:13:47: 1992MHz 0.42 31% 27% 0% 0% 0% 3% 56.1°C 04:13:52: 1992MHz 0.47 30% 25% 0% 0% 0% 4% 56.1°C 04:13:58: 1992MHz 0.51 30% 25% 0% 0% 0% 4% 56.1°C 04:14:03: 1992MHz 0.55 30% 25% 0% 0% 0% 4% 56.1°C 04:14:08: 1992MHz 0.58 30% 25% 0% 0% 0% 4% 56.1°C 04:14:13: 1992MHz 0.62 30% 25% 0% 0% 0% 5% 56.1°C 04:14:18: 1992MHz 0.65 30% 25% 0% 0% 0% 5% 56.1°C 04:14:23: 1992MHz 0.68 30% 25% 0% 0% 0% 4% 56.1°C 04:14:28: 1992MHz 0.70 30% 25% 0% 0% 0% 4% 56.1°C 04:14:34: 1992MHz 0.82 30% 26% 0% 0% 0% 4% 56.1°C 04:14:39: 1104MHz 0.76 26% 22% 0% 0% 0% 3% 53.8°C ^C |
Again the CPU operates are full speed, and far from 100% utilization so the bottlenecks must be somewhere else. We can again check eth2 info and stats with ethtool.
|
1 2 3 4 5 6 7 8 9 10 11 |
$ sudo ethtool -i eth2 driver: r8125 version: 9.008.00-NAPI firmware-version: expansion-rom-version: bus-info: 0001:11:00.0 supports-statistics: yes supports-test: no supports-eeprom-access: no supports-register-dump: yes supports-priv-flags: no |
|
1 2 3 4 5 6 7 8 9 10 11 12 13 14 15 16 17 18 19 20 21 22 23 24 25 26 27 28 29 30 31 32 33 34 35 36 37 38 39 40 41 |
sudo ethtool -S eth2 NIC statistics: tx_packets: 8506609 rx_packets: 12553353 tx_errors: 0 rx_errors: 0 rx_missed: 0 align_errors: 0 tx_single_collisions: 0 tx_multi_collisions: 0 unicast: 12553209 broadcast: 144 multicast: 0 tx_aborted: 0 tx_underrun: 0 tx_octets: 12543719502 rx_octets: 18471602900 rx_multicast64: 0 tx_unicast64: 8503557 tx_broadcast64: 3035 tx_multicast64: 17 tx_pause_on: 35 tx_pause_off: 35 tx_pause_all: 70 tx_deferred: 0 tx_late_collision: 0 tx_all_collision: 0 tx_aborted32: 0 align_errors32: 0 rx_frame_too_long: 0 rx_runt: 0 rx_pause_on: 0 rx_pause_off: 0 rx_pause_all: 0 rx_unknown_opcode: 0 rx_mac_error: 0 tx_underrun32: 0 rx_mac_missed: 335 rx_tcam_dropped: 0 tdu: 0 rdu: 35 |
We’ve got more rx_mac_missed here. So there will be some tweaks to improve the performance, but based on my experience with RTL8156B adjusting settings is really tricky, and experienced people don’t seem to agree on what to adjust, I’m talking about Realtek engineers working on RTL8156/8125 drivers vs regular readers here that are experts in networking.
Configuring NAT between the two 2.5GbE interfaces
Since the 2.5GbE interfaces don’t work optimally with iperf3, I did not bother testing the router performance in FriendlyWrt, but several people still asked. So I’ll show how I configured NAT in Ubuntu 20.04, and still test NAT performance bearing in mind it will certainly have improved in a few weeks or months.
We’ll need to enable IP forwarding and NAT. I used instructions adapted from a post on networkreverse.
Edit /etc/sysctl.conf to enable IP forwarding (uncomment the following line):
|
1 |
net.ipv4.ip_forward=1 |
Apply the changes:
|
1 |
sudo sysctl -p |
Now let’s enable NAT:
|
1 |
sudo iptables ! -o lo -t nat -A POSTROUTING -j MASQUERADE |
We can now ping UP Xtreme i11 on 192.168.3.0 subnet from my laptop on 192.168.2.0 subnet:
|
1 2 3 4 |
jaufranc@cnx-laptop-4:~$ ping 192.168.3.100 PING 192.168.3.100 (192.168.3.100) 56(84) bytes of data. 64 bytes from 192.168.3.100: icmp_seq=1 ttl=63 time=0.690 ms 64 bytes from 192.168.3.100: icmp_seq=2 ttl=63 time=0.764 ms |
If you want to make the changes permanent:
|
1 2 |
sudo apt install iptables-persistent sudo sh -c 'iptables-save > /etc/iptables/rules.v4' |
Let’s try iperf3 between UP Xtreme i11 and my laptop with the data routed through the NanoPi R5S router.
|
1 2 3 4 5 6 7 8 9 10 11 12 13 14 15 16 17 18 19 20 21 22 23 24 25 26 27 28 29 30 31 32 33 |
jaufranc@cnx-laptop-4:~$ iperf3 -t 60 -c 192.168.3.100 -i 10 Connecting to host 192.168.3.100, port 5201 [ 5] local 192.168.2.130 port 59430 connected to 192.168.3.100 port 5201 [ ID] Interval Transfer Bitrate Retr Cwnd [ 5] 0.00-10.00 sec 914 MBytes 767 Mbits/sec 355 1011 KBytes [ 5] 10.00-20.00 sec 912 MBytes 765 Mbits/sec 324 1.23 MBytes [ 5] 20.00-30.00 sec 917 MBytes 769 Mbits/sec 124 1.09 MBytes [ 5] 30.00-40.00 sec 915 MBytes 767 Mbits/sec 150 942 KBytes [ 5] 40.00-50.00 sec 915 MBytes 767 Mbits/sec 78 1.22 MBytes [ 5] 50.00-60.00 sec 919 MBytes 771 Mbits/sec 64 1.03 MBytes - - - - - - - - - - - - - - - - - - - - - - - - - [ ID] Interval Transfer Bitrate Retr [ 5] 0.00-60.00 sec 5.36 GBytes 768 Mbits/sec 1095 sender [ 5] 0.00-60.06 sec 5.36 GBytes 767 Mbits/sec receiver iperf Done. jaufranc@cnx-laptop-4:~$ iperf3 -t 60 -c 192.168.3.100 -i 10 -R Connecting to host 192.168.3.100, port 5201 Reverse mode, remote host 192.168.3.100 is sending [ 5] local 192.168.2.130 port 59434 connected to 192.168.3.100 port 5201 [ ID] Interval Transfer Bitrate [ 5] 0.00-10.00 sec 1.09 GBytes 935 Mbits/sec [ 5] 10.00-20.00 sec 1.09 GBytes 938 Mbits/sec [ 5] 20.00-30.00 sec 1.09 GBytes 938 Mbits/sec [ 5] 30.00-40.00 sec 1.09 GBytes 938 Mbits/sec [ 5] 40.00-50.00 sec 1.09 GBytes 939 Mbits/sec [ 5] 50.00-60.00 sec 1.09 GBytes 937 Mbits/sec - - - - - - - - - - - - - - - - - - - - - - - - - [ ID] Interval Transfer Bitrate Retr [ 5] 0.00-60.05 sec 6.55 GBytes 937 Mbits/sec 973 sender [ 5] 0.00-60.00 sec 6.55 GBytes 937 Mbits/sec receiver iperf Done. |
768 Mbps in one direction and 937 Mbps in the other.
|
1 2 3 4 5 6 7 8 9 10 11 12 13 14 15 16 17 18 19 20 21 22 23 24 25 26 27 28 29 30 31 32 33 34 35 36 37 38 |
pi@FriendlyELEC:~$ sudo ./sbc-bench.sh -m Rockchip RK3568 (35682000), Kernel: aarch64, Userland: arm64 CPU sysfs topology (clusters, cpufreq members, clockspeeds) cpufreq min max CPU cluster policy speed speed core type 0 0 0 408 1992 Cortex-A55 / r2p0 1 0 0 408 1992 Cortex-A55 / r2p0 2 0 0 408 1992 Cortex-A55 / r2p0 3 0 0 408 1992 Cortex-A55 / r2p0 Thermal source: /sys/devices/virtual/thermal/thermal_zone0/ (soc-thermal) Time CPU load %cpu %sys %usr %nice %io %irq Temp 05:00:01: 1608MHz 0.16 4% 3% 0% 0% 0% 1% 52.5°C 05:00:06: 1992MHz 0.15 21% 0% 0% 0% 1% 19% 53.8°C 05:00:11: 1992MHz 0.22 25% 0% 0% 0% 0% 25% 53.8°C 05:00:16: 1992MHz 0.28 25% 0% 0% 0% 0% 25% 53.8°C 05:00:21: 1992MHz 0.34 25% 0% 0% 0% 0% 25% 53.8°C 05:00:26: 1992MHz 0.39 25% 0% 0% 0% 0% 25% 53.8°C 05:00:31: 1992MHz 0.44 25% 0% 0% 0% 0% 25% 54.4°C 05:00:36: 1992MHz 0.49 25% 0% 0% 0% 0% 25% 53.8°C 05:00:41: 1992MHz 0.53 25% 0% 0% 0% 0% 25% 53.8°C 05:00:47: 1992MHz 0.57 25% 0% 0% 0% 0% 25% 53.8°C 05:00:52: 1992MHz 0.84 25% 0% 0% 0% 0% 24% 53.8°C 05:00:57: 1992MHz 0.94 25% 0% 0% 0% 0% 25% 54.4°C 05:01:02: 1104MHz 0.86 24% 0% 0% 0% 0% 24% 52.5°C 05:01:07: 1992MHz 0.79 16% 0% 0% 0% 0% 15% 54.4°C 05:01:12: 1992MHz 0.81 25% 0% 0% 0% 0% 25% 54.4°C 05:01:17: 1992MHz 0.83 25% 0% 0% 0% 0% 25% 54.4°C 05:01:22: 1992MHz 0.84 25% 0% 0% 0% 0% 24% 54.4°C 05:01:27: 1992MHz 0.85 25% 0% 0% 0% 0% 25% 55.0°C 05:01:33: 1992MHz 0.87 25% 0% 0% 0% 0% 25% 54.4°C 05:01:38: 1992MHz 0.88 25% 0% 0% 0% 0% 25% 54.4°C 05:01:43: 1992MHz 0.89 25% 0% 0% 0% 0% 25% 55.0°C 05:01:48: 1992MHz 0.90 25% 0% 0% 0% 0% 25% 54.4°C 05:01:53: 1992MHz 0.90 25% 0% 0% 0% 0% 25% 54.4°C 05:01:58: 1992MHz 0.91 25% 0% 0% 0% 0% 25% 54.4°C 05:02:03: 1992MHz 0.92 25% 0% 0% 0% 0% 25% 54.4°C |
Monitoring with sbc-bench.sh show the processor runs at 1992 MHz (or 1845 MHz real), and again the 25% IRQ should mean one core is fully utilized to handle IRQs.
The mpstat command shows this should handled by core #0
|
1 2 3 4 5 6 7 8 9 |
$ mpstat -P ALL -I SUM Linux 5.10.66 (FriendlyELEC) 06/05/22 _aarch64_ (4 CPU) 09:52:53 CPU intr/s 09:52:53 all 226.34 09:52:53 0 174.51 09:52:53 1 20.32 09:52:53 2 21.34 09:52:53 3 10.16 |
And this can be confirmed by using top and htop.
NanoPi R5S power consumption
I’ve just got a wall power meter to check power consumption:
- Idle – 5.1 Watts
- Iperf3 to eth1 – 6.3 to 6.7 Watts
- NAT test between laptop and mini PC – 6.2W
The numbers above are with Ubuntu 20.04 and the NVMe SSD installed.
I’ve also tested on NanoPi R5S with OpenWrt and no SSD:
- Idle – 4.6 Watts
- Iperf3 – 6.0 to 6.2 Watts
Note that since I’m using a wall power meter any efficiency loss in the power adapter (Khadas VIM4 USB-C power adapter) will be included and the values may be higher than with a USB-C power meter. It might also be possible to optimize power consumption with settings.
Final words
I’ll stop here for today. Optimizations should include changing the firmware to get Rockchip cores to run at 1992 MHz, and adjusting various settings related to PCIe and Ethernet settings, most of which I’m not familiar with (yet).
I’d like to thank FriendlyElec for sending review samples of NanoPi R5S mini router. The router with metal enclosure can be purchased on FriendlyElec website for $75, or you can get the board only for $59. The router can also be found on Aliexpress from several sellers, some of which also sell a 4GB RAM version, which is odd since FriendlyElec only sells the model with 2GB RAM at this time.

Jean-Luc started CNX Software in 2010 as a part-time endeavor, before quitting his job as a software engineering manager, and starting to write daily news, and reviews full time later in 2011.
Support CNX Software! Donate via cryptocurrencies, become a Patron on Patreon, or purchase goods on Amazon or Aliexpress


