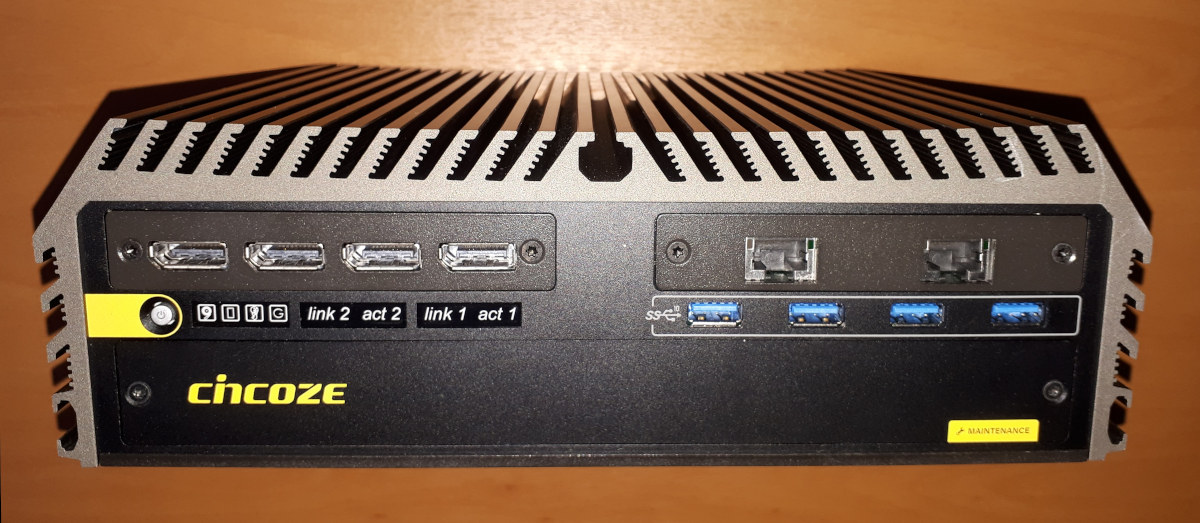
Cincoze GM-1000 is an industrial embedded GPU computer. It is highly expandable including supporting an embedded MXM GPU. As a rugged computer, it can either be passively cooled or actively cooled with add-on fans. It can support an operating temperature ranging from -40°C – 70°C and is also able to survive being dropped or hit with a vibration/shock tolerance of 5G/50G. It is marketed as having all the features required for a compact, reliable, and high-performance computing system for field applications in machine vision, image processing, and artificial intelligence.
In this review, I’ll cover some performance metrics from both Windows and Ubuntu and also discuss the thermals.
Hardware Overview
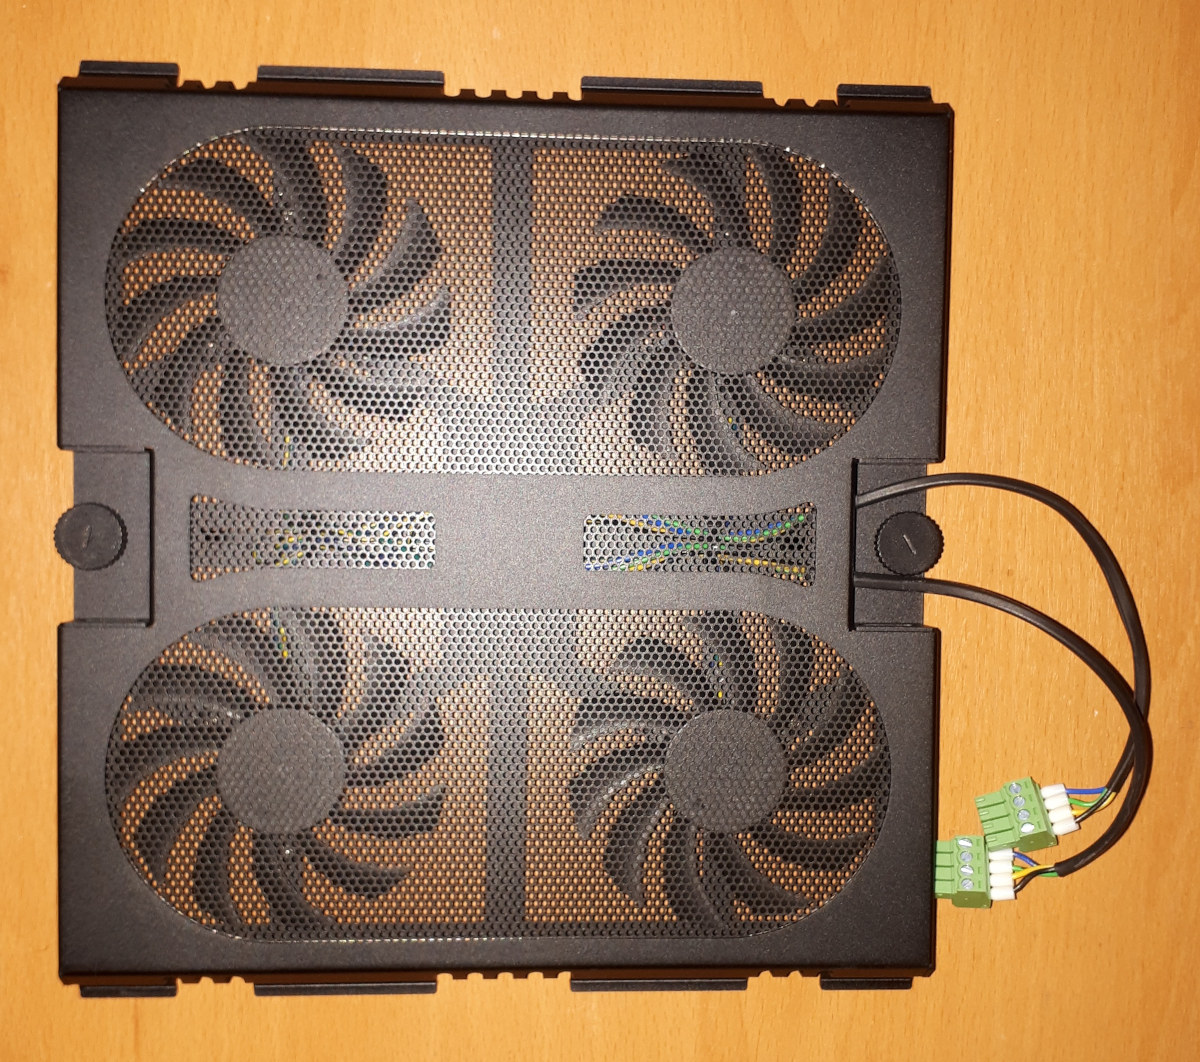
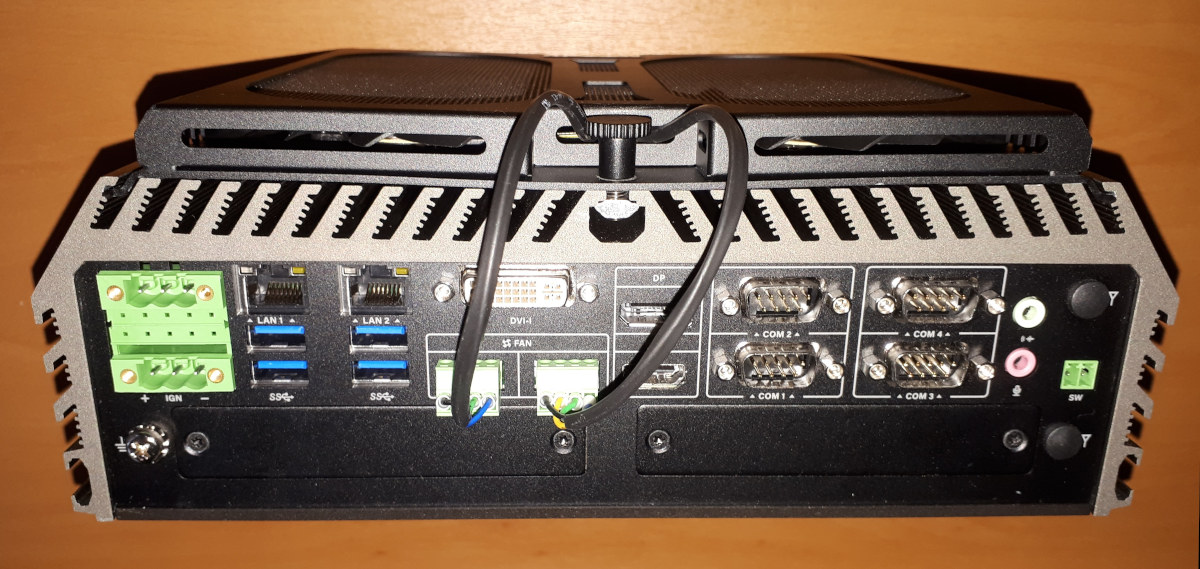
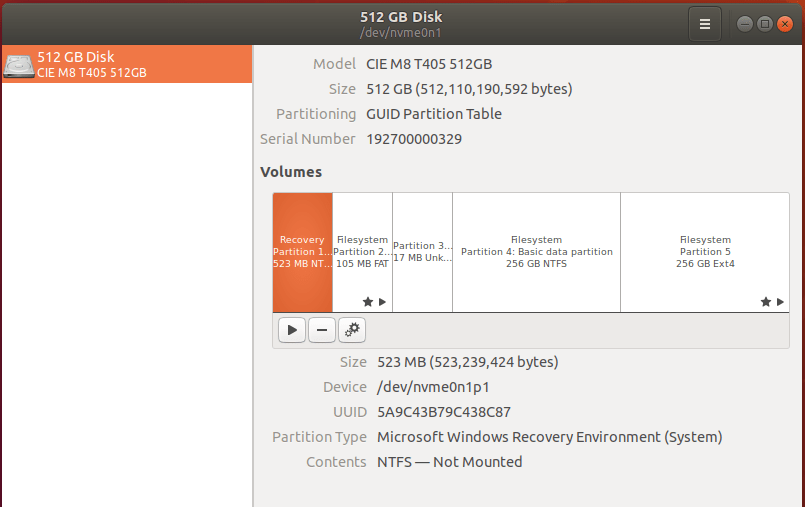
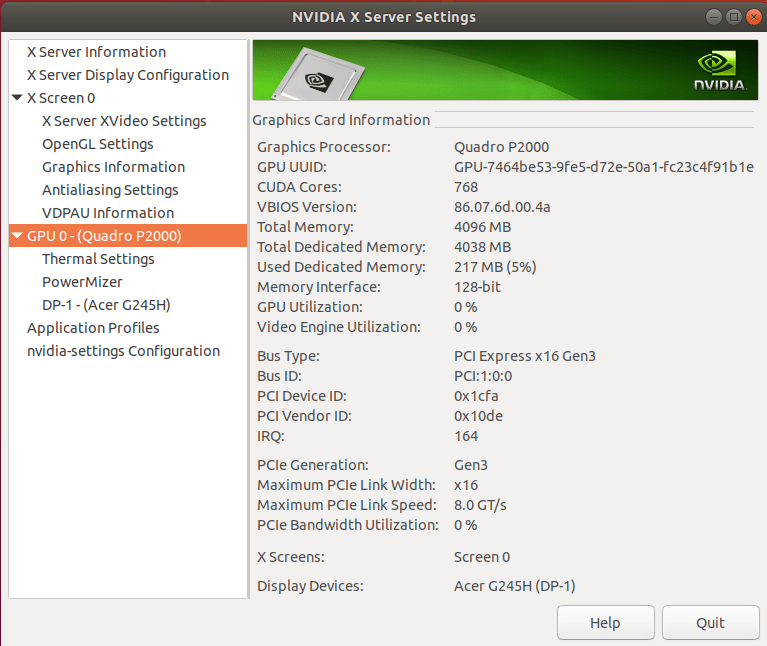
The model loaned by Cincoze for review came with an Intel Core i7-9700TE which is an eight-core 8-thread 1.80 GHz Coffee Lake-R processor boosting to 3.80 GHz with Intel’s UHD Graphics 630. It also came with an NVIDIA Quadro Embedded P2000 MXM module installed, 32GB of RAM, and a 512GB NVMe drive together with an expansion of 2x 10G Intel X550 RJ45 LAN ports and an ‘External Fan Kit’ which allows four 80mm fans to be installed on top of the device:
The unit cosmetically looks like a giant heat sink and measures 260 mm x 200 mm x 85 mm (10.24 x 7.87 x 3.35 inches) with a weight of 4.6 kg (10 pounds 2.26 ounces). It also requires a large power brick (GST220A24-CIN) rated at 221W.
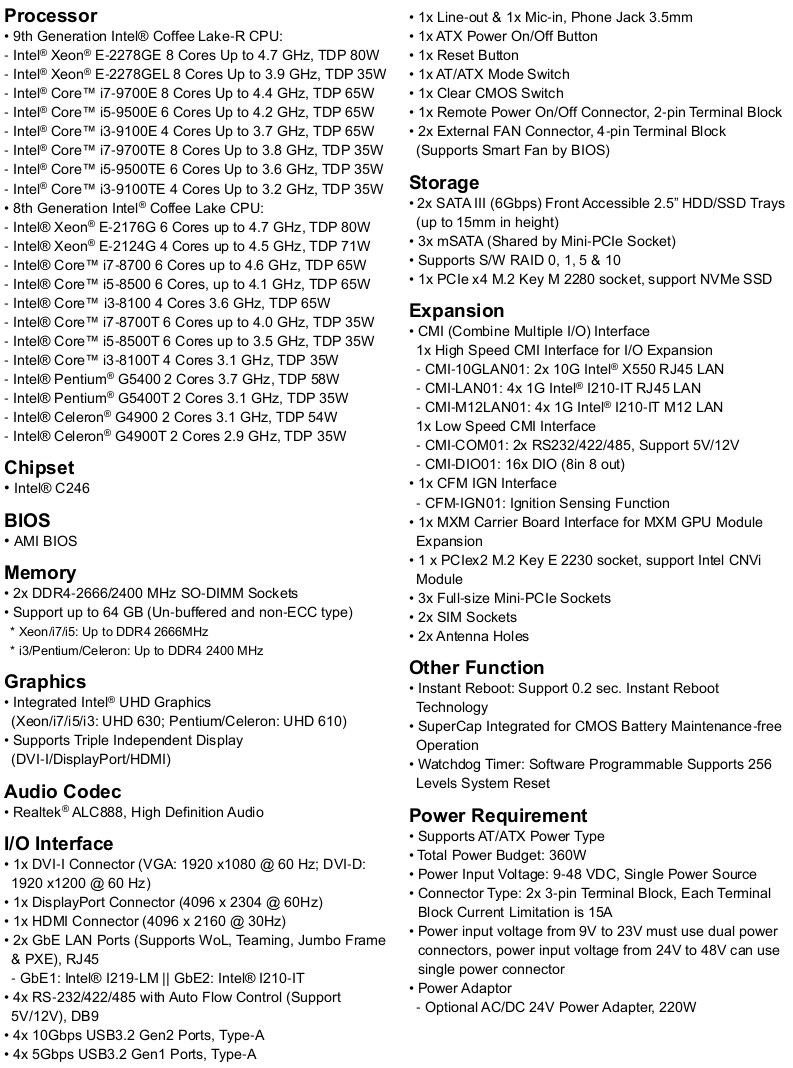
The full specification including all configurable/expansion options for the GM-1000 include:
Review Methodology
Being an industrial unit I decided to review using a dual-boot of Windows 10 IOT Enterprise LTSC version 1809 and Ubuntu 18.04 LTS point release 5 and test with a selection of commonly used Windows benchmarks and/or equivalents for Linux together with Thomas Kaiser’s ‘sbc-bench’ which is a small set of different CPU performance tests focusing on server performance when run on Ubuntu. Additionally, I used ‘Phoronix Test Suite’ to benchmark the same set of tests on both Windows and Ubuntu for comparison purposes. On Ubuntu, I also compiled the v5.4 Linux kernel using the default config as a test of performance.
Prior to benchmarking, I perform all the necessary installations and updates. I also capture some basic details of the device for each OS.
Installation Issues
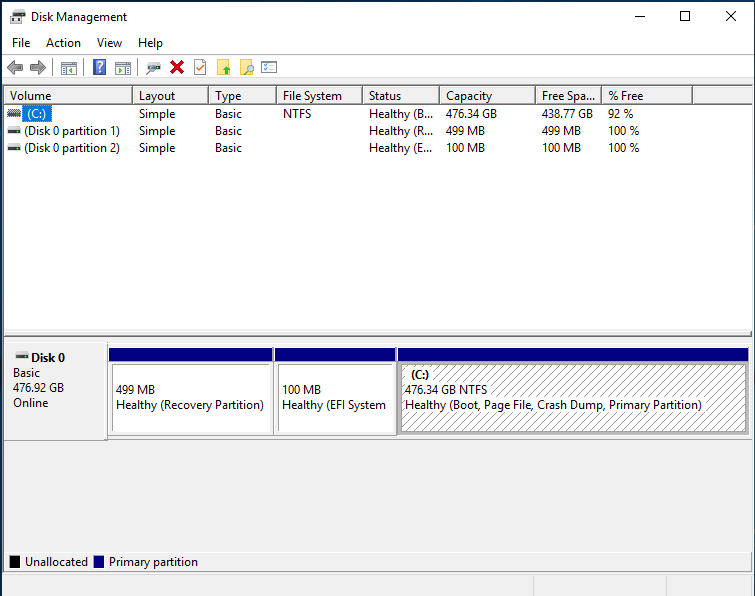
The embedded GPU computer came with Ubuntu already installed with a preconfigured user (‘cincoze’) and an unknown password. To boot Ubuntu with a single monitor there were effectively six connection options of either the HDMI or DisplayPort outputs on the rear of the device or any of the four DisplayPort outputs on the front of the device which are provided by the MXM-P2000 module. However when trying to boot into the BIOS only the four DisplayPort outputs on the front of the device display anything. This was also the case when trying to boot from an installation USB.
So Windows was installed using a front DisplayPort connection and after installation Ethernet was not detected. Fortunately, all the required Windows drivers are available from the Cincoze ‘SUPPORTS’ webpage with the exception of the NVIDIA driver required for the P2000. After installing the NVIDIA driver when booting with a monitor connected to a rear output port the display used Intel UHD Graphics 630 and if booted when connected to a front DisplayPort the NVIDIA Quadro P2000 was used.
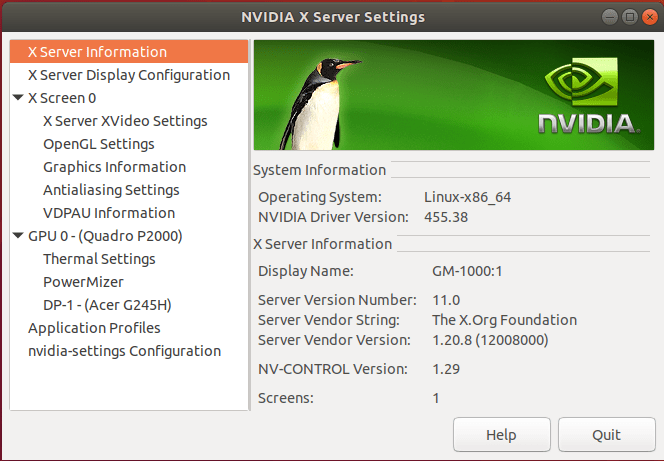
Installing Ubuntu was similarly straightforward by performing an installation without selecting the ‘Install third-party software for graphics’ option. Although this resulted with no display when booting with the monitor connected to a rear HDMI output (although I didn’t try ‘nomodeset’) the display worked with Ubuntu when connected to a front DisplayPort output as it used the ‘llvmpipe’ graphics driver allowing me to use ‘Additional Drivers’ in ‘Software & Updates’ to select and use the NVIDIA driver metapackage. Then regardless of whether connected using a rear or front output port the graphics display driver always showed as Quadro P2000. Importantly though when connected by a rear output port and then booting the GRUB menu is not visible as this can only be seen when connected by one of the front DisplayPort outputs.
One other point to note was that the ‘Selenium’ test from the ‘Phoronix Test Suite’ benchmarks refused to run the ‘Chrome’ option so the Octane tests had to be run manually and edited into the final results.
Windows Performance
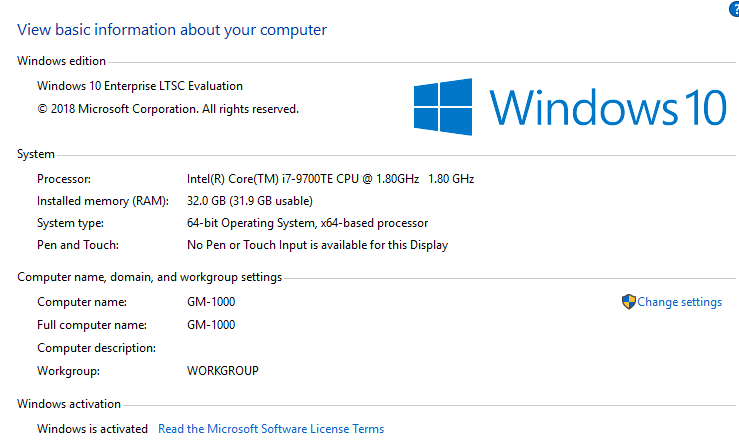
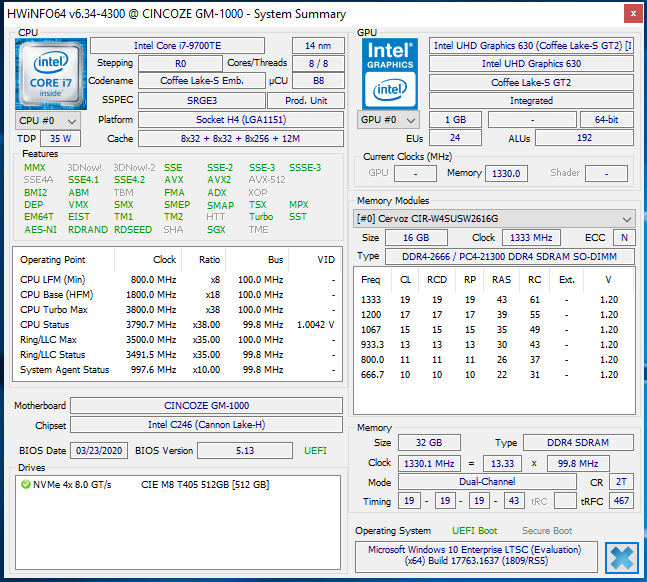
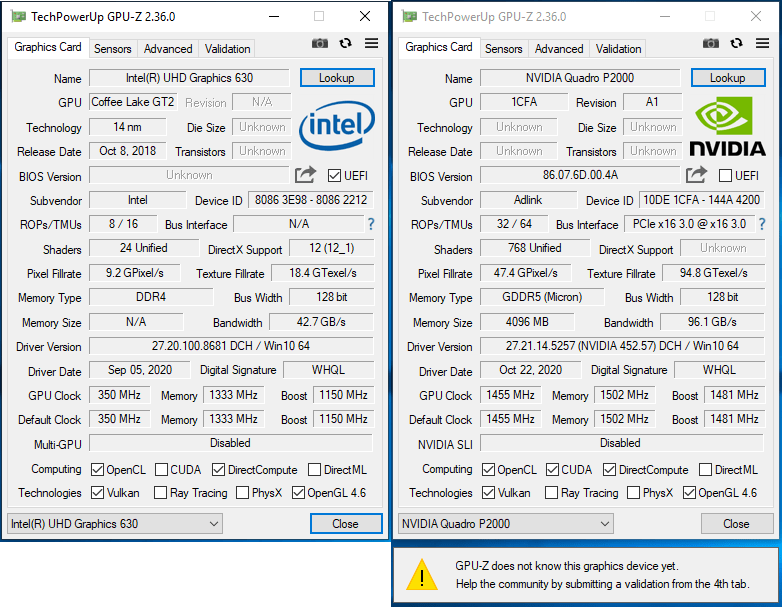
I first installed Windows 10 Enterprise LTSC Evaluation version 1809 and updated to OS build 17763.1637. A quick look at the hardware information shows:
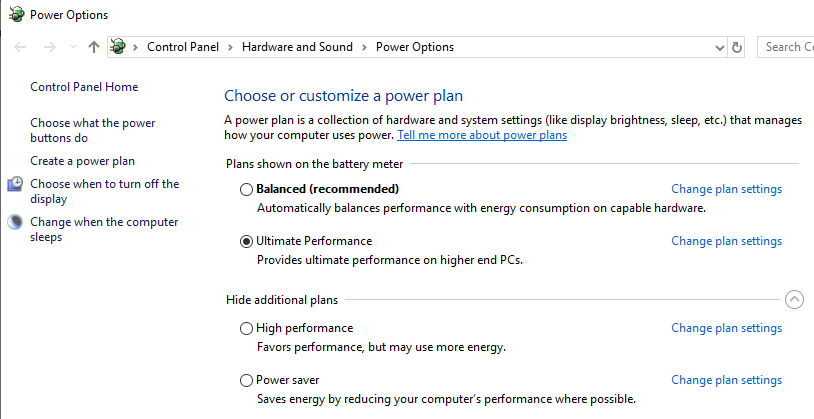
I then set the power plan to ‘Ultimate Performance’:
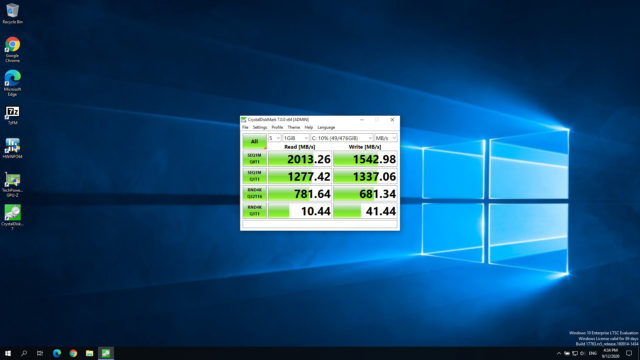
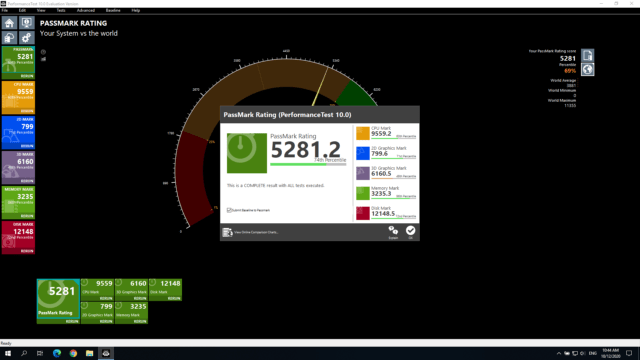
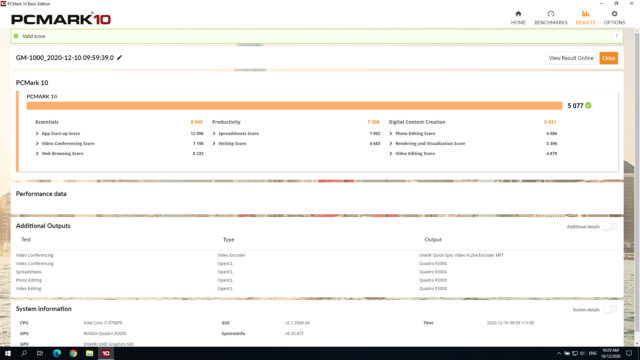
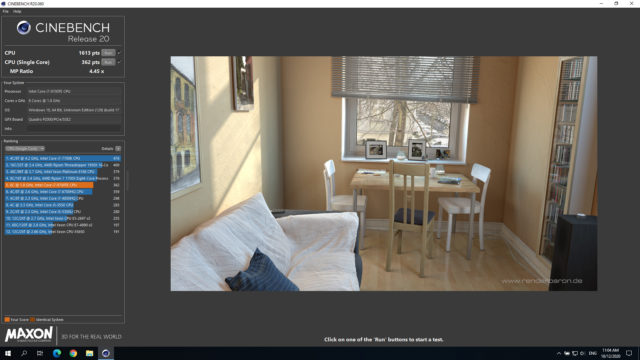
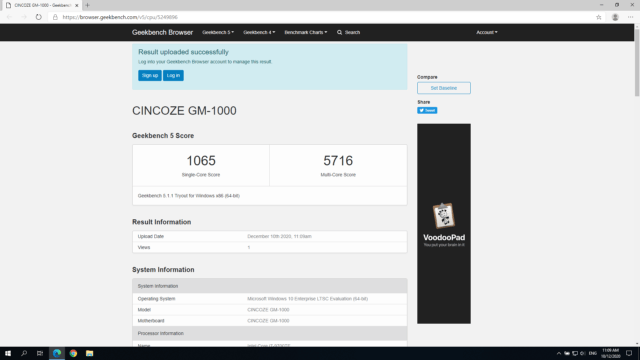
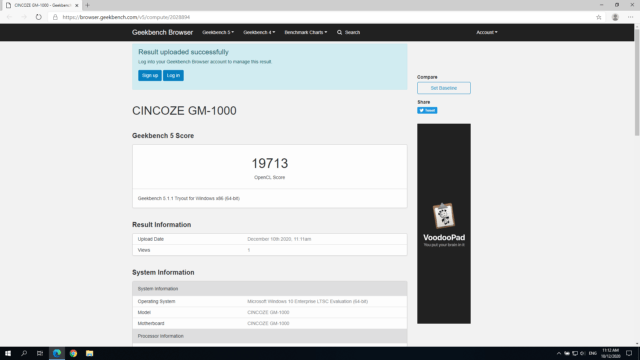
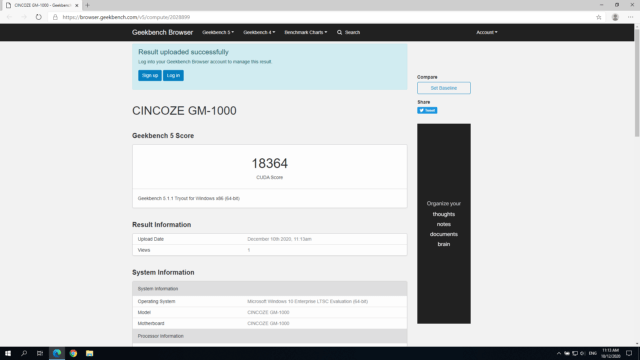
and ran some benchmarking tools to look at performance under Windows:
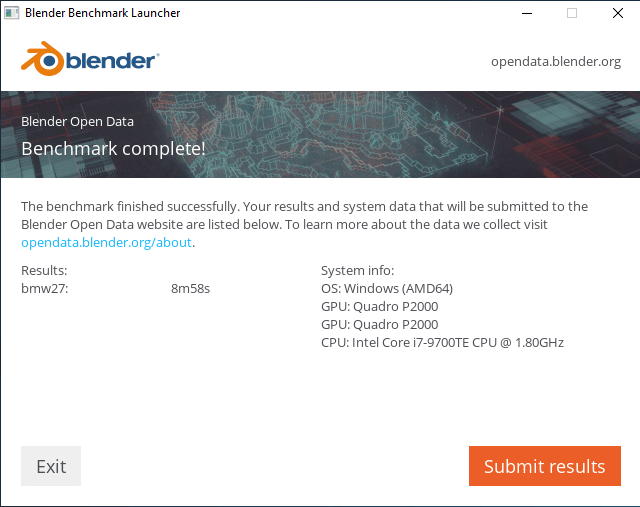
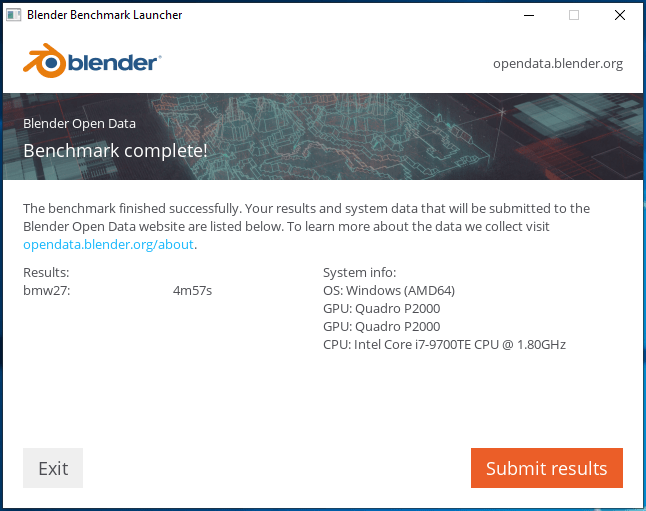
I also tested the Blender ‘BMW’ benchmark for both CPU and GPU (CUDA):
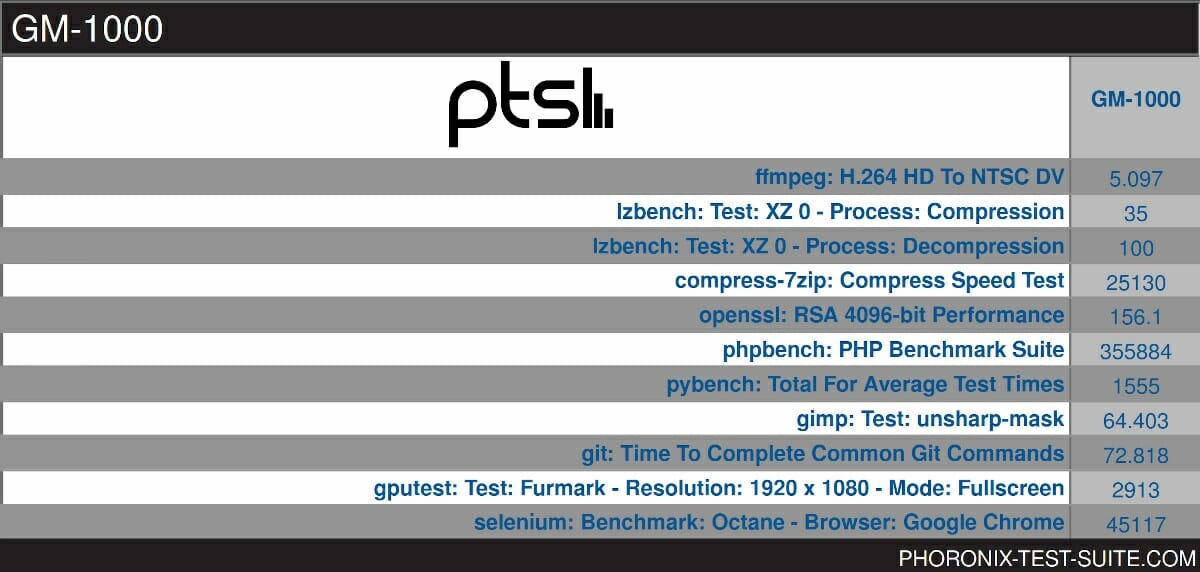
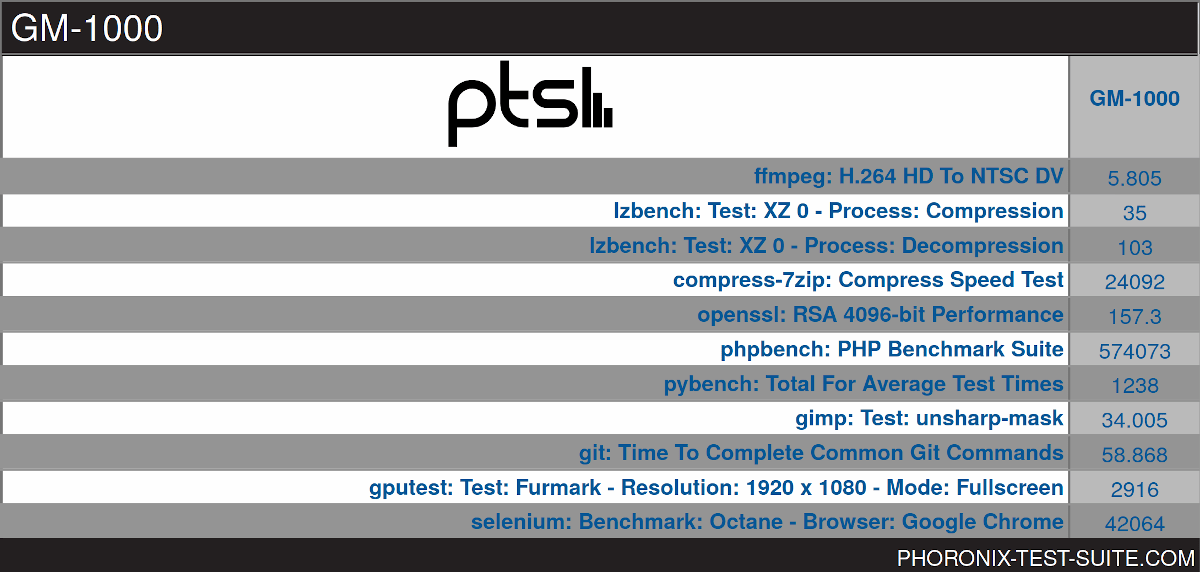
For my specific set of Phoronix Test Suite tests the results were:
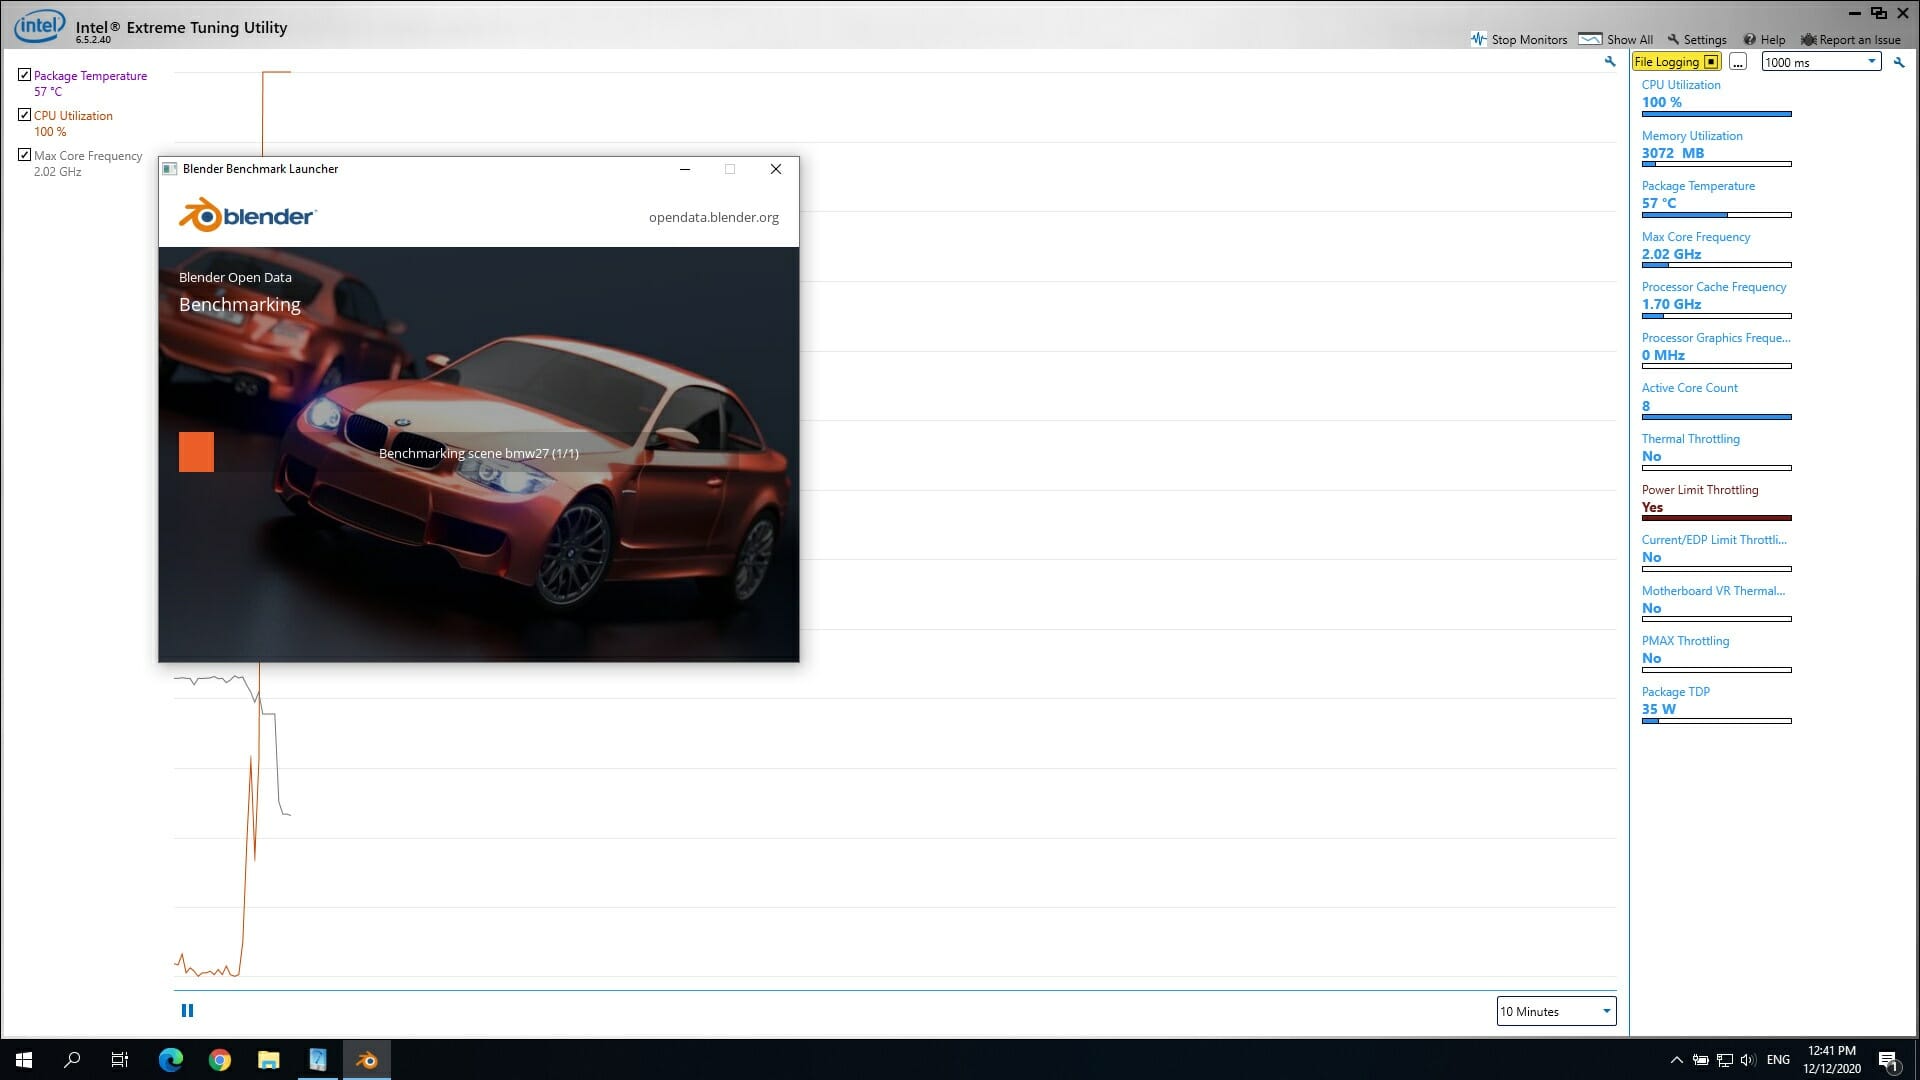
The CPU performance is limited due to the low 35W TDP of the processor coupled with PL1 being set to match it at 35W. The result is ‘Power Limit Throttling’ where the processor is down-clocked or throttled to ensure it remains within its thermal envelope:
Ubuntu Performance
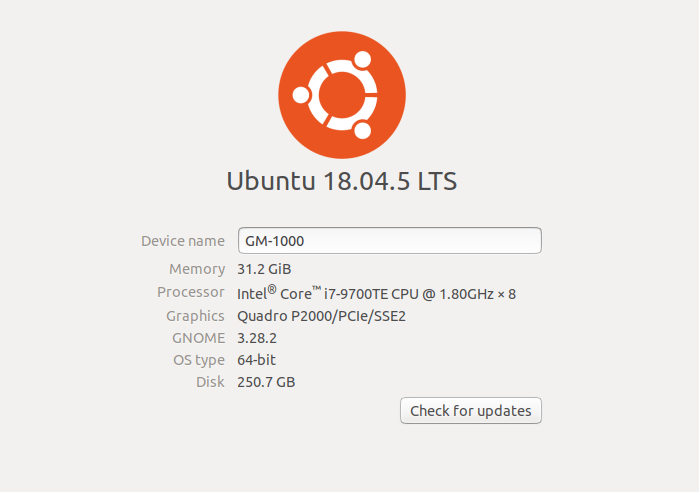
After shrinking the Windows partition in half and creating a new partition I installed Ubuntu using an Ubuntu 18.04.5 ISO as dual boot. After installation and updates, the key hardware information is as follows:
|
1 2 3 4 5 6 7 8 9 10 11 12 13 14 15 16 17 18 19 20 21 22 23 24 25 26 27 28 29 30 31 32 33 34 35 36 37 38 39 40 41 42 43 44 45 46 47 48 49 50 51 52 53 54 55 56 57 58 59 60 61 62 63 64 65 66 67 68 69 70 71 72 73 74 75 76 77 78 79 80 81 82 83 84 85 86 87 88 89 90 91 92 93 94 95 96 97 98 99 100 101 102 103 104 105 106 107 108 109 110 111 112 113 114 115 116 117 118 119 120 121 122 123 124 125 126 127 128 129 130 131 132 133 134 135 136 137 138 139 140 141 142 143 144 145 146 147 148 149 150 151 152 153 154 155 156 157 158 159 160 161 162 163 164 165 166 167 168 169 170 171 172 173 174 175 176 177 178 179 180 181 182 183 184 185 186 187 188 189 190 191 192 193 194 195 196 197 198 199 200 201 202 203 204 205 206 207 208 209 210 211 212 213 214 215 216 217 218 219 220 221 222 223 224 225 226 227 228 229 230 231 232 233 234 235 236 237 238 239 240 241 242 243 244 245 246 247 248 249 250 251 252 253 254 255 256 257 258 259 260 261 262 263 264 265 266 267 268 269 270 271 272 273 274 275 276 277 278 279 280 281 282 283 284 285 286 287 288 289 290 291 292 293 294 295 296 297 298 299 300 301 302 303 |
linuxium@GM-1000:~$ lsb_release -a Distributor ID: Ubuntu Description: Ubuntu 18.04.5 LTS Release: 18.04 Codename: bionic linuxium@GM-1000:~$ linuxium@GM-1000:~$ uname -a Linux GM-1000 5.4.0-54-generic #60~18.04.1-Ubuntu SMP Fri Nov 6 17:25:16 UTC 2020 x86_64 x86_64 x86_64 GNU/Linux linuxium@GM-1000:~$ linuxium@GM-1000:~$ inxi -Fc0 System: Host: GM-1000 Kernel: 5.4.0-54-generic x86_64 bits: 64 Console: tty 0 Distro: Ubuntu 18.04.5 LTS Machine: Device: desktop System: CINCOZE product: GM-1000 v: 0.0.01.001 serial: N/A Mobo: CINCOZE model: GM-1000 v: 0.0.01.001 serial: N/A UEFI: American Megatrends v: 5.13 date: 03/23/2020 Battery BAT0: charge: 10.0 Wh 100.0% condition: 10.0/10.0 Wh (100%) CPU: 8 core Intel Core i7-9700TE (-MCP-) cache: 12288 KB clock speeds: max: 3800 MHz 1: 3688 MHz 2: 3695 MHz 3: 3619 MHz 4: 3695 MHz 5: 3611 MHz 6: 3660 MHz 7: 3605 MHz 8: 3698 MHz Graphics: Card-1: Intel Device 3e98 Card-2: NVIDIA Device 1cfa Display Server: X.Org 1.20.8 drivers: modesetting,nvidia (unloaded: fbdev,vesa,nouveau) Resolution: 1920x1080@60.00hz OpenGL: renderer: Quadro P2000/PCIe/SSE2 version: 4.6.0 NVIDIA 455.38 Audio: Card-1 NVIDIA GP107GL High Definition Audio Controller driver: snd_hda_intel Card-2 Intel Cannon Lake PCH cAVS driver: snd_hda_intel Sound: Advanced Linux Sound Architecture v: k5.4.0-54-generic Network: Card-1: Intel Ethernet Connection (7) I219-LM driver: e1000e IF: eno1 state: up speed: 1000 Mbps duplex: full mac: xx:xx:xx:xx:xx:xx Card-2: Intel Ethernet Controller 10G X550T driver: ixgbe IF: enp3s0f0 state: down mac: xx:xx:xx:xx:xx:xx Card-3: Intel Ethernet Controller 10G X550T driver: ixgbe IF: enp3s0f1 state: down mac: xx:xx:xx:xx:xx:xx Card-4: Intel I210 Gigabit Network Connection driver: igb IF: enp4s0 state: down mac: xx:xx:xx:xx:xx:xx Drives: HDD Total Size: 512.1GB (3.3% used) ID-1: /dev/nvme0n1 model: CIE_M8_T405_512GB size: 512.1GB Partition: ID-1: / size: 234G used: 16G (8%) fs: ext4 dev: /dev/nvme0n1p5 RAID: No RAID devices: /proc/mdstat, md_mod kernel module present Sensors: System Temperatures: cpu: 54.0C mobo: N/A gpu: 51C Fan Speeds (in rpm): cpu: N/A Info: Processes: 296 Uptime: 46 min Memory: 2012.8/31975.9MB Client: Shell (new.review-test) inxi: 2.3.56 linuxium@GM-1000:~$ linuxium@GM-1000:~$ df -h Filesystem Size Used Avail Use% Mounted on udev 16G 0 16G 0% /dev tmpfs 3.2G 2.1M 3.2G 1% /run /dev/nvme0n1p5 234G 16G 206G 8% / tmpfs 16G 0 16G 0% /dev/shm tmpfs 5.0M 4.0K 5.0M 1% /run/lock tmpfs 16G 0 16G 0% /sys/fs/cgroup /dev/loop1 30M 30M 0 100% /snap/snapd/8542 /dev/loop2 56M 56M 0 100% /snap/core18/1885 /dev/loop3 2.3M 2.3M 0 100% /snap/gnome-system-monitor/148 /dev/loop4 1.0M 1.0M 0 100% /snap/gnome-logs/100 /dev/loop5 256M 256M 0 100% /snap/gnome-3-34-1804/36 /dev/loop0 63M 63M 0 100% /snap/gtk-common-themes/1506 /dev/loop6 384K 384K 0 100% /snap/gnome-characters/550 /dev/loop7 2.5M 2.5M 0 100% /snap/gnome-calculator/748 /dev/nvme0n1p2 96M 31M 66M 32% /boot/efi tmpfs 3.2G 16K 3.2G 1% /run/user/121 tmpfs 3.2G 52K 3.2G 1% /run/user/1000 linuxium@GM-1000:~$ linuxium@GM-1000:~$ lsblk -a NAME MAJ:MIN RM SIZE RO TYPE MOUNTPOINT loop0 7:0 0 62.1M 1 loop /snap/gtk-common-themes/1506 loop1 7:1 0 29.9M 1 loop /snap/snapd/8542 loop2 7:2 0 55.3M 1 loop /snap/core18/1885 loop3 7:3 0 2.2M 1 loop /snap/gnome-system-monitor/148 loop4 7:4 0 956K 1 loop /snap/gnome-logs/100 loop5 7:5 0 255.6M 1 loop /snap/gnome-3-34-1804/36 loop6 7:6 0 276K 1 loop /snap/gnome-characters/550 loop7 7:7 0 2.4M 1 loop /snap/gnome-calculator/748 loop8 7:8 0 0 loop nvme0n1 259:0 0 477G 0 disk ├─nvme0n1p1 259:1 0 499M 0 part ├─nvme0n1p2 259:2 0 100M 0 part /boot/efi ├─nvme0n1p3 259:3 0 16M 0 part ├─nvme0n1p4 259:4 0 238.2G 0 part └─nvme0n1p5 259:5 0 238.2G 0 part / linuxium@GM-1000:~$ linuxium@GM-1000:~$ sudo lshw -C cpu *-cpu description: CPU product: Intel(R) Core(TM) i7-9700TE CPU @ 1.80GHz vendor: Intel Corp. physical id: 48 bus info: cpu@0 version: Intel(R) Core(TM) i7-9700TE CPU @ 1.80GHz serial: To Be Filled By O.E.M. slot: U3E1 size: 3656MHz capacity: 4005MHz width: 64 bits clock: 100MHz capabilities: x86-64 fpu fpu_exception wp vme de pse tsc msr pae mce cx8 apic sep mtrr pge mca cmov pat pse36 clflush dts acpi mmx fxsr sse sse2 ss ht tm pbe syscall nx pdpe1gb rdtscp constant_tsc art arch_perfmon pebs bts rep_good nopl xtopology nonstop_tsc cpuid aperfmperf pni pclmulqdq dtes64 monitor ds_cpl vmx smx est tm2 ssse3 sdbg fma cx16 xtpr pdcm pcid sse4_1 sse4_2 x2apic movbe popcnt tsc_deadline_timer aes xsave avx f16c rdrand lahf_lm abm 3dnowprefetch cpuid_fault epb invpcid_single ssbd ibrs ibpb stibp ibrs_enhanced tpr_shadow vnmi flexpriority ept vpid ept_ad fsgsbase tsc_adjust bmi1 avx2 smep bmi2 erms invpcid mpx rdseed adx smap clflushopt intel_pt xsaveopt xsavec xgetbv1 xsaves dtherm ida arat pln pts hwp hwp_notify hwp_act_window hwp_epp md_clear flush_l1d arch_capabilities cpufreq configuration: cores=8 enabledcores=8 threads=8 linuxium@GM-1000:~$ linuxium@GM-1000:~$ sudo lshw -C memory *-firmware description: BIOS vendor: American Megatrends Inc. physical id: 0 version: 5.13 date: 03/23/2020 size: 64KiB capacity: 15MiB capabilities: pci upgrade shadowing cdboot bootselect socketedrom edd int13floppy1200 int13floppy720 int13floppy2880 int5printscreen int9keyboard int14serial int17printer acpi usb biosbootspecification uefi *-memory description: System Memory physical id: 3a slot: System board or motherboard size: 32GiB *-bank:0 description: SODIMM DDR4 Synchronous 2667 MHz (0.4 ns) product: CIR-W4SUSW2616G vendor: 8AD3 physical id: 0 serial: xxxxxxxx slot: ChannelA-DIMM0 size: 16GiB width: 64 bits clock: 2667MHz (0.4ns) *-bank:1 description: Project-Id-Version: lshwReport-Msgid-Bugs-To: FULL NAME <EMAIL@ADDRESS>PO-Revision-Date: 2012-02-02 13:04+0000Last-Translator: Joel Addison <jaddi27@gmail.com>Language-Team: English (Australia) <en_AU@li.org>MIME-Version: 1.0Content-Type: text/plain; charset=UTF-8Content-Transfer-Encoding: 8bitX-Launchpad-Export-Date: 2018-07-12 13:19+0000X-Generator: Launchpad (build 18719)Project-Id-Version: lshwReport-Msgid-Bugs-To: FULL NAME <EMAIL@ADDRESS>PO-Revision-Date: 2012-02-02 13:04+0000Last-Translator: Joel Addison <jaddi27@gmail.com>Language-Team: English (Australia) <en_AU@li.org>MIME-Version: 1.0Content-Type: text/plain; charset=UTF-8Content-Transfer-Encoding: 8bitX-Launchpad-Export-Date: 2018-07-12 13:19+0000X-Generator: Launchpad (build 18719) [empty] physical id: 1 slot: ChannelA-DIMM1 *-bank:2 description: SODIMM DDR4 Synchronous 2667 MHz (0.4 ns) product: CIR-W4SUSW2616G vendor: 8AD3 physical id: 2 serial: xxxxxxxx slot: ChannelB-DIMM0 size: 16GiB width: 64 bits clock: 2667MHz (0.4ns) *-bank:3 description: Project-Id-Version: lshwReport-Msgid-Bugs-To: FULL NAME <EMAIL@ADDRESS>PO-Revision-Date: 2012-02-02 13:04+0000Last-Translator: Joel Addison <jaddi27@gmail.com>Language-Team: English (Australia) <en_AU@li.org>MIME-Version: 1.0Content-Type: text/plain; charset=UTF-8Content-Transfer-Encoding: 8bitX-Launchpad-Export-Date: 2018-07-12 13:19+0000X-Generator: Launchpad (build 18719)Project-Id-Version: lshwReport-Msgid-Bugs-To: FULL NAME <EMAIL@ADDRESS>PO-Revision-Date: 2012-02-02 13:04+0000Last-Translator: Joel Addison <jaddi27@gmail.com>Language-Team: English (Australia) <en_AU@li.org>MIME-Version: 1.0Content-Type: text/plain; charset=UTF-8Content-Transfer-Encoding: 8bitX-Launchpad-Export-Date: 2018-07-12 13:19+0000X-Generator: Launchpad (build 18719) [empty] physical id: 3 slot: ChannelB-DIMM1 *-cache:0 description: L1 cache physical id: 45 slot: L1 Cache size: 512KiB capacity: 512KiB capabilities: synchronous internal write-back unified configuration: level=1 *-cache:1 description: L2 cache physical id: 46 slot: L2 Cache size: 2MiB capacity: 2MiB capabilities: synchronous internal write-back unified configuration: level=2 *-cache:2 description: L3 cache physical id: 47 slot: L3 Cache size: 12MiB capacity: 12MiB capabilities: synchronous internal write-back unified configuration: level=3 *-memory UNCLAIMED description: RAM memory product: Cannon Lake PCH Shared SRAM vendor: Intel Corporation physical id: 14.2 bus info: pci@0000:00:14.2 version: 10 width: 64 bits clock: 33MHz (30.3ns) capabilities: pm cap_list configuration: latency=0 resources: memory:a5536000-a5537fff memory:a553d000-a553dfff linuxium@GM-1000:~$ linuxium@GM-1000:~$ free -mh total used free shared buff/cache available Mem: 31G 1.4G 20G 27M 9.2G 29G Swap: 2.0G 0B 2.0G linuxium@GM-1000:~$ linuxium@GM-1000:~$ sudo lshw -C network *-network:0 description: Ethernet interface product: Ethernet Controller 10G X550T vendor: Intel Corporation physical id: 0 bus info: pci@0000:03:00.0 logical name: enp3s0f0 version: 01 serial: xx:xx:xx:xx:xx:xx capacity: 10Gbit/s width: 64 bits clock: 33MHz capabilities: pm msi msix pciexpress bus_master cap_list rom ethernet physical tp 100bt-fd 1000bt-fd 10000bt-fd autonegotiation configuration: autonegotiation=on broadcast=yes driver=ixgbe driverversion=5.1.0-k firmware=0x80000d43, 1.1937.0 latency=0 link=no multicast=yes port=twisted pair resources: irq:16 memory:a2800000-a2bfffff memory:a2c04000-a2c07fff memory:a5600000-a567ffff memory:a5700000-a57fffff memory:a5800000-a58fffff *-network:1 description: Ethernet interface product: Ethernet Controller 10G X550T vendor: Intel Corporation physical id: 0.1 bus info: pci@0000:03:00.1 logical name: enp3s0f1 version: 01 serial: xx:xx:xx:xx:xx:xx capacity: 10Gbit/s width: 64 bits clock: 33MHz capabilities: pm msi msix pciexpress bus_master cap_list rom ethernet physical tp 100bt-fd 1000bt-fd 10000bt-fd autonegotiation configuration: autonegotiation=on broadcast=yes driver=ixgbe driverversion=5.1.0-k firmware=0x80000d43, 1.1937.0 latency=0 link=no multicast=yes port=twisted pair resources: irq:17 memory:a2400000-a27fffff memory:a2c00000-a2c03fff memory:a5680000-a56fffff memory:a5900000-a59fffff memory:a5a00000-a5afffff *-network description: Ethernet interface product: I210 Gigabit Network Connection vendor: Intel Corporation physical id: 0 bus info: pci@0000:04:00.0 logical name: enp4s0 version: 03 serial: xx:xx:xx:xx:xx:xx capacity: 1Gbit/s width: 32 bits clock: 33MHz capabilities: pm msi msix pciexpress bus_master cap_list ethernet physical tp 10bt 10bt-fd 100bt 100bt-fd 1000bt-fd autonegotiation configuration: autonegotiation=on broadcast=yes driver=igb driverversion=5.6.0-k firmware=3.20, 0x80000550 latency=0 link=no multicast=yes port=twisted pair resources: irq:17 memory:a5200000-a527ffff ioport:3000(size=32) memory:a5280000-a5283fff *-network description: Ethernet interface product: Ethernet Connection (7) I219-LM vendor: Intel Corporation physical id: 1f.6 bus info: pci@0000:00:1f.6 logical name: eno1 version: 10 serial: xx:xx:xx:xx:xx:xx size: 1Gbit/s capacity: 1Gbit/s width: 32 bits clock: 33MHz capabilities: pm msi bus_master cap_list ethernet physical tp 10bt 10bt-fd 100bt 100bt-fd 1000bt-fd autonegotiation configuration: autonegotiation=on broadcast=yes driver=e1000e driverversion=3.2.6-k duplex=full firmware=0.5-3 ip=xxx.xxx.xxx.xxx latency=0 link=yes multicast=yes port=twisted pair speed=1Gbit/s resources: irq:128 memory:a5500000-a551ffff linuxium@GM-1000:~$ linuxium@GM-1000:~$ sudo lshw -C display *-display description: VGA compatible controller product: NVIDIA Corporation vendor: NVIDIA Corporation physical id: 0 bus info: pci@0000:01:00.0 version: a1 width: 64 bits clock: 33MHz capabilities: pm msi pciexpress vga_controller bus_master cap_list rom configuration: driver=nvidia latency=0 resources: irq:164 memory:a4000000-a4ffffff memory:90000000-9fffffff memory:a0000000-a1ffffff ioport:4000(size=128) memory:c0000-dffff *-display description: Display controller product: Intel Corporation vendor: Intel Corporation physical id: 2 bus info: pci@0000:00:02.0 version: 02 width: 64 bits clock: 33MHz capabilities: pciexpress msi pm bus_master cap_list configuration: driver=i915 latency=0 resources: irq:162 memory:a3000000-a3ffffff memory:80000000-8fffffff ioport:5000(size=64) linuxium@GM-1000:~$ linuxium@GM-1000:~$ lsusb Bus 002 Device 001: ID 1d6b:0003 Linux Foundation 3.0 root hub Bus 001 Device 003: ID 093a:2510 Pixart Imaging, Inc. Optical Mouse Bus 001 Device 002: ID 046d:c31c Logitech, Inc. Keyboard K120 Bus 001 Device 001: ID 1d6b:0002 Linux Foundation 2.0 root hub linuxium@GM-1000:~$ linuxium@GM-1000:~$ lspci -nn 00:00.0 Host bridge [0600]: Intel Corporation Device [8086:3e30] (rev 0d) 00:01.0 PCI bridge [0604]: Intel Corporation Xeon E3-1200 v5/E3-1500 v5/6th Gen Core Processor PCIe Controller (x16) [8086:1901] (rev 0d) 00:02.0 Display controller [0380]: Intel Corporation Device [8086:3e98] (rev 02) 00:08.0 System peripheral [0880]: Intel Corporation Xeon E3-1200 v5/v6 / E3-1500 v5 / 6th/7th Gen Core Processor Gaussian Mixture Model [8086:1911] 00:12.0 Signal processing controller [1180]: Intel Corporation Cannon Lake PCH Thermal Controller [8086:a379] (rev 10) 00:14.0 USB controller [0c03]: Intel Corporation Cannon Lake PCH USB 3.1 xHCI Host Controller [8086:a36d] (rev 10) 00:14.2 RAM memory [0500]: Intel Corporation Cannon Lake PCH Shared SRAM [8086:a36f] (rev 10) 00:16.0 Communication controller [0780]: Intel Corporation Cannon Lake PCH HECI Controller [8086:a360] (rev 10) 00:16.3 Serial controller [0700]: Intel Corporation Device [8086:a363] (rev 10) 00:17.0 SATA controller [0106]: Intel Corporation Cannon Lake PCH SATA AHCI Controller [8086:a352] (rev 10) 00:1b.0 PCI bridge [0604]: Intel Corporation Cannon Lake PCH PCI Express Root Port 21 [8086:a32c] (rev f0) 00:1c.0 PCI bridge [0604]: Intel Corporation Device [8086:a33c] (rev f0) 00:1d.0 PCI bridge [0604]: Intel Corporation Device [8086:a335] (rev f0) 00:1f.0 ISA bridge [0601]: Intel Corporation Device [8086:a309] (rev 10) 00:1f.3 Audio device [0403]: Intel Corporation Cannon Lake PCH cAVS [8086:a348] (rev 10) 00:1f.4 SMBus [0c05]: Intel Corporation Cannon Lake PCH SMBus Controller [8086:a323] (rev 10) 00:1f.5 Serial bus controller [0c80]: Intel Corporation Cannon Lake PCH SPI Controller [8086:a324] (rev 10) 00:1f.6 Ethernet controller [0200]: Intel Corporation Ethernet Connection (7) I219-LM [8086:15bb] (rev 10) 01:00.0 VGA compatible controller [0300]: NVIDIA Corporation Device [10de:1cfa] (rev a1) 01:00.1 Audio device [0403]: NVIDIA Corporation GP107GL High Definition Audio Controller [10de:0fb9] (rev a1) 02:00.0 Non-Volatile memory controller [0108]: Silicon Motion, Inc. Device [126f:2263] (rev 03) 03:00.0 Ethernet controller [0200]: Intel Corporation Ethernet Controller 10G X550T [8086:1563] (rev 01) 03:00.1 Ethernet controller [0200]: Intel Corporation Ethernet Controller 10G X550T [8086:1563] (rev 01) 04:00.0 Ethernet controller [0200]: Intel Corporation I210 Gigabit Network Connection [8086:1533] (rev 03) linuxium@GM-1000:~$ |
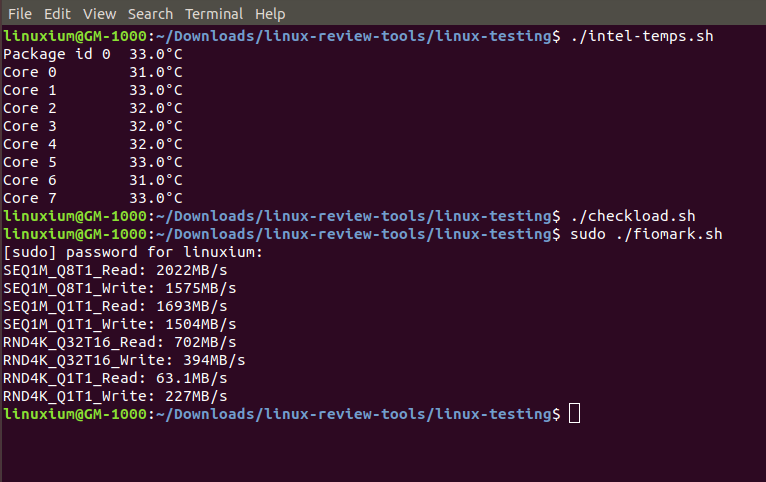
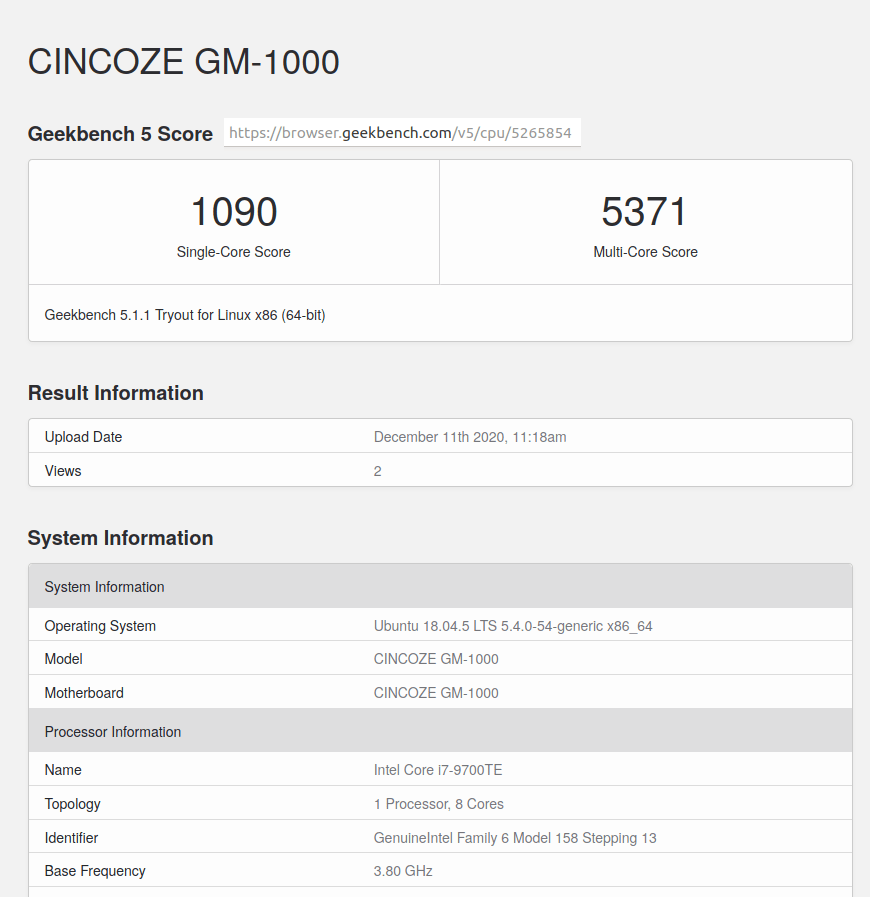
I then set the CPU Scaling Governor to ‘performance’ and ran some Linux benchmarks:
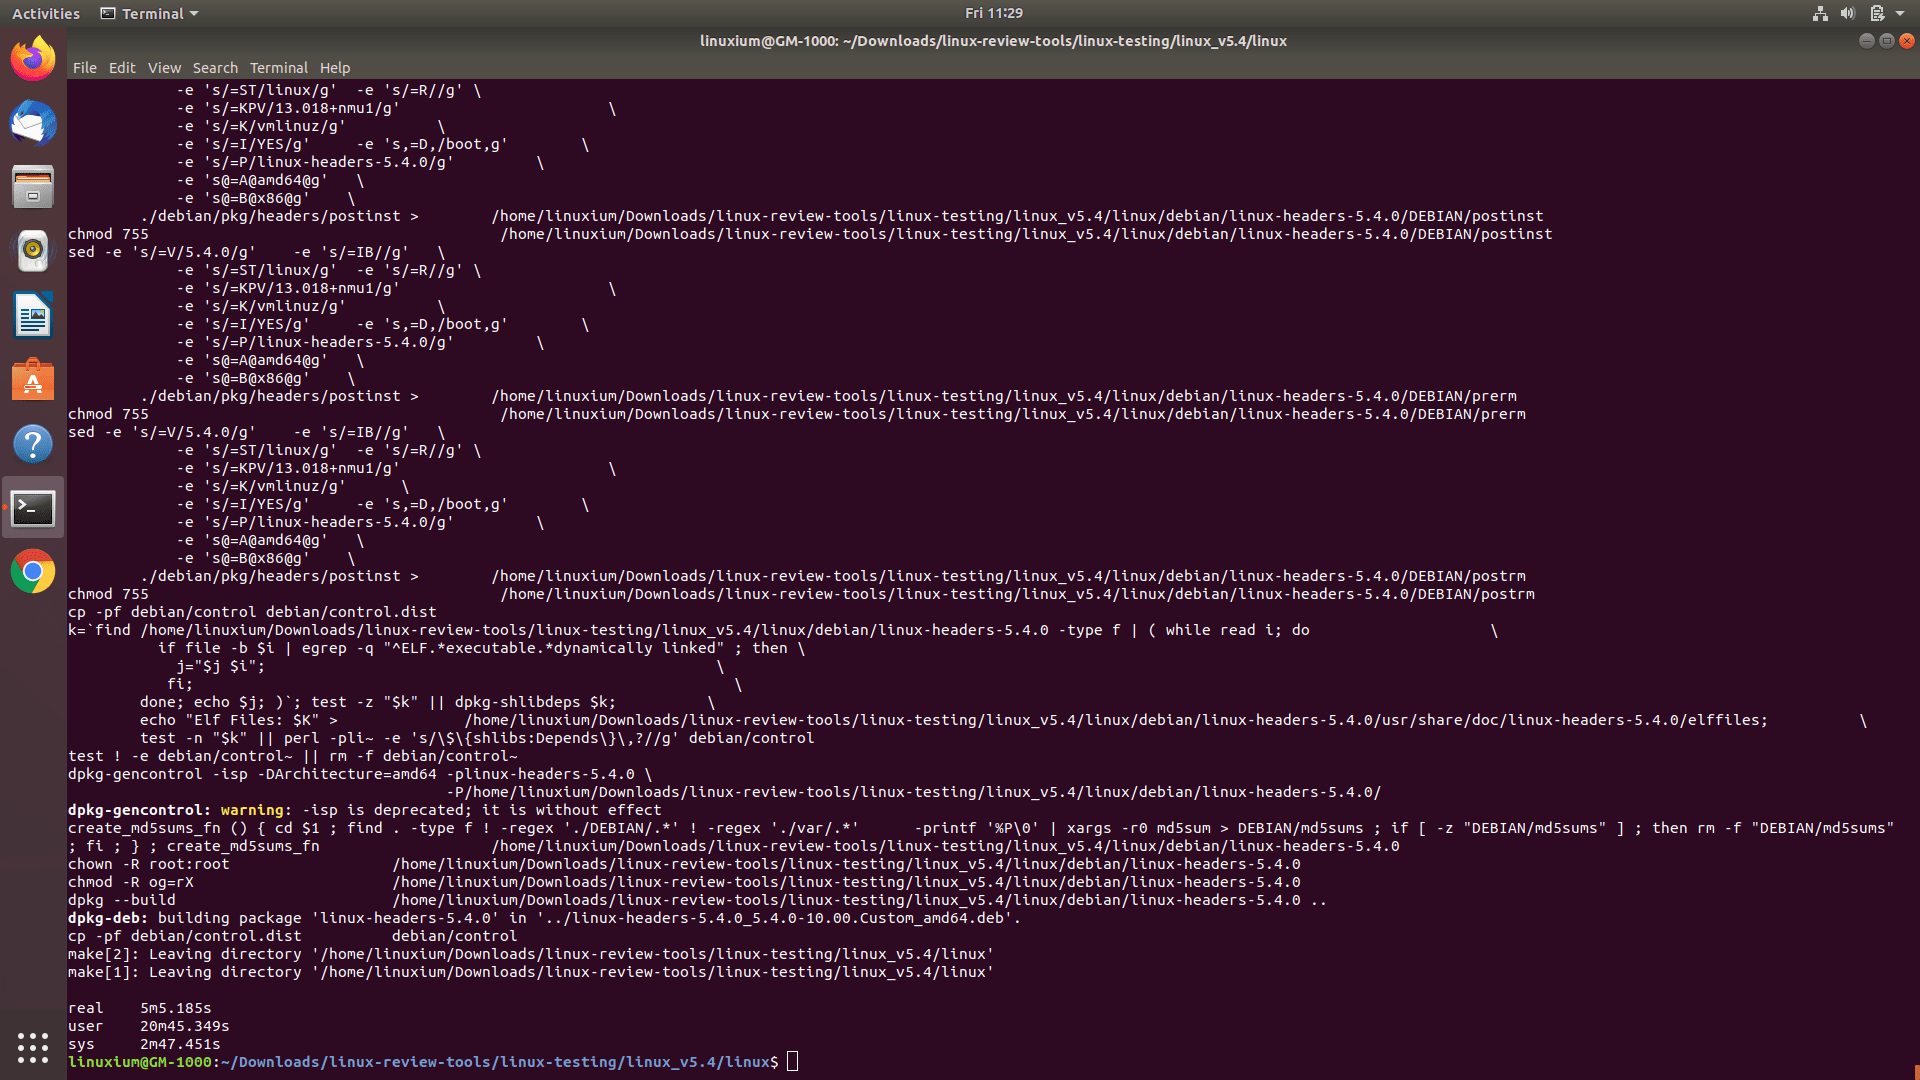
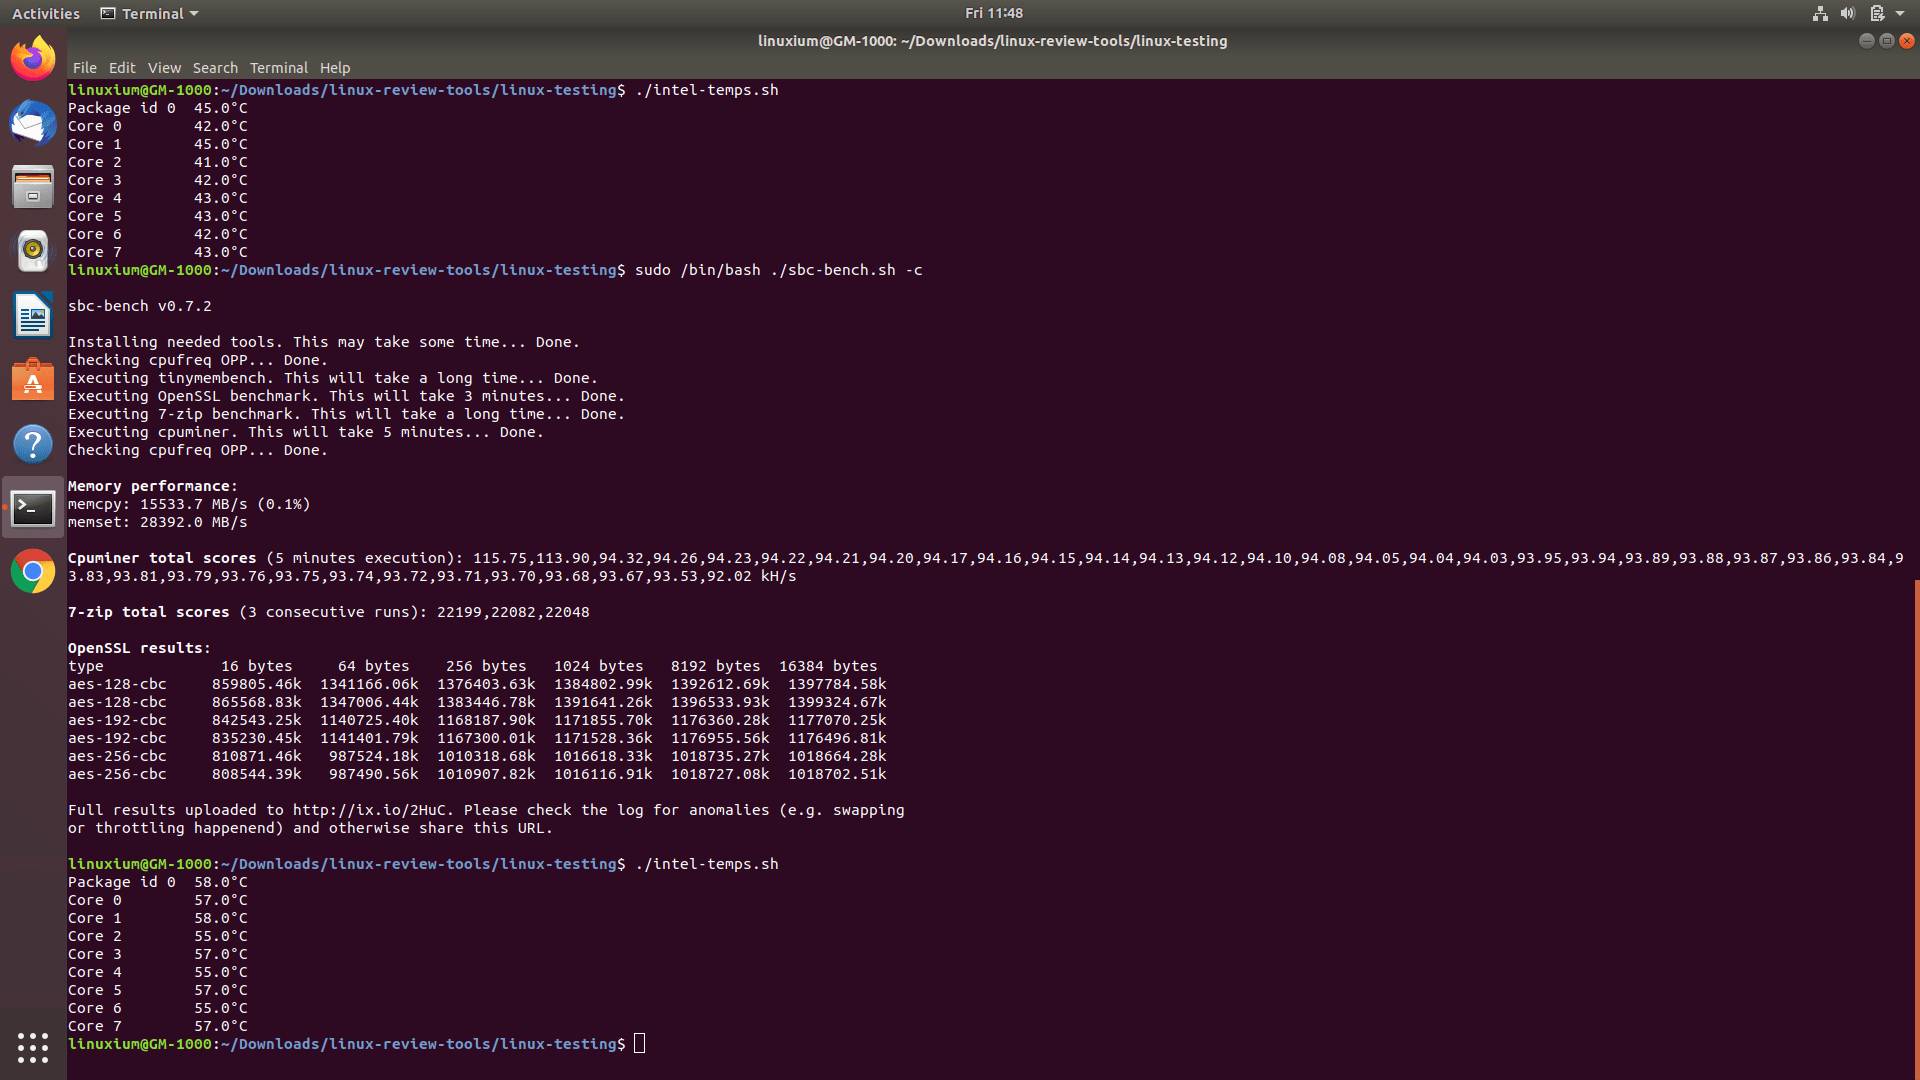
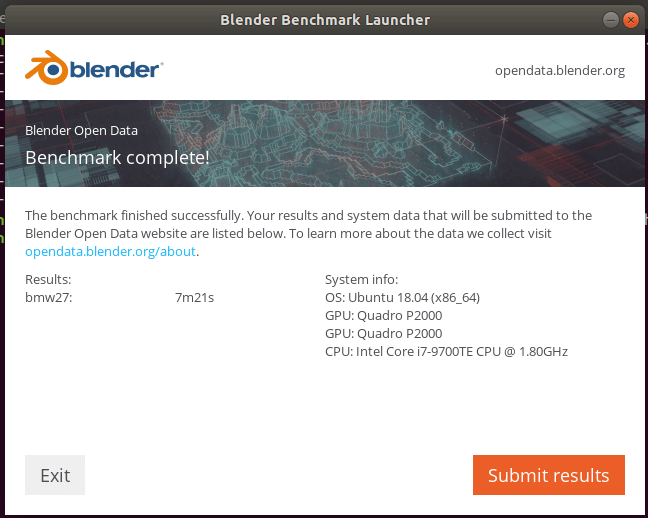
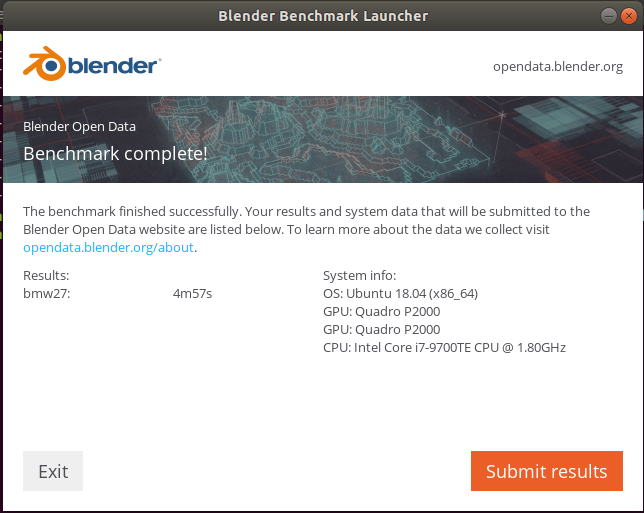
and also tested the Blender ‘BMW’ benchmark for both CPU and GPU (CUDA):
For the same set of Phoronix Test Suite tests the results were:
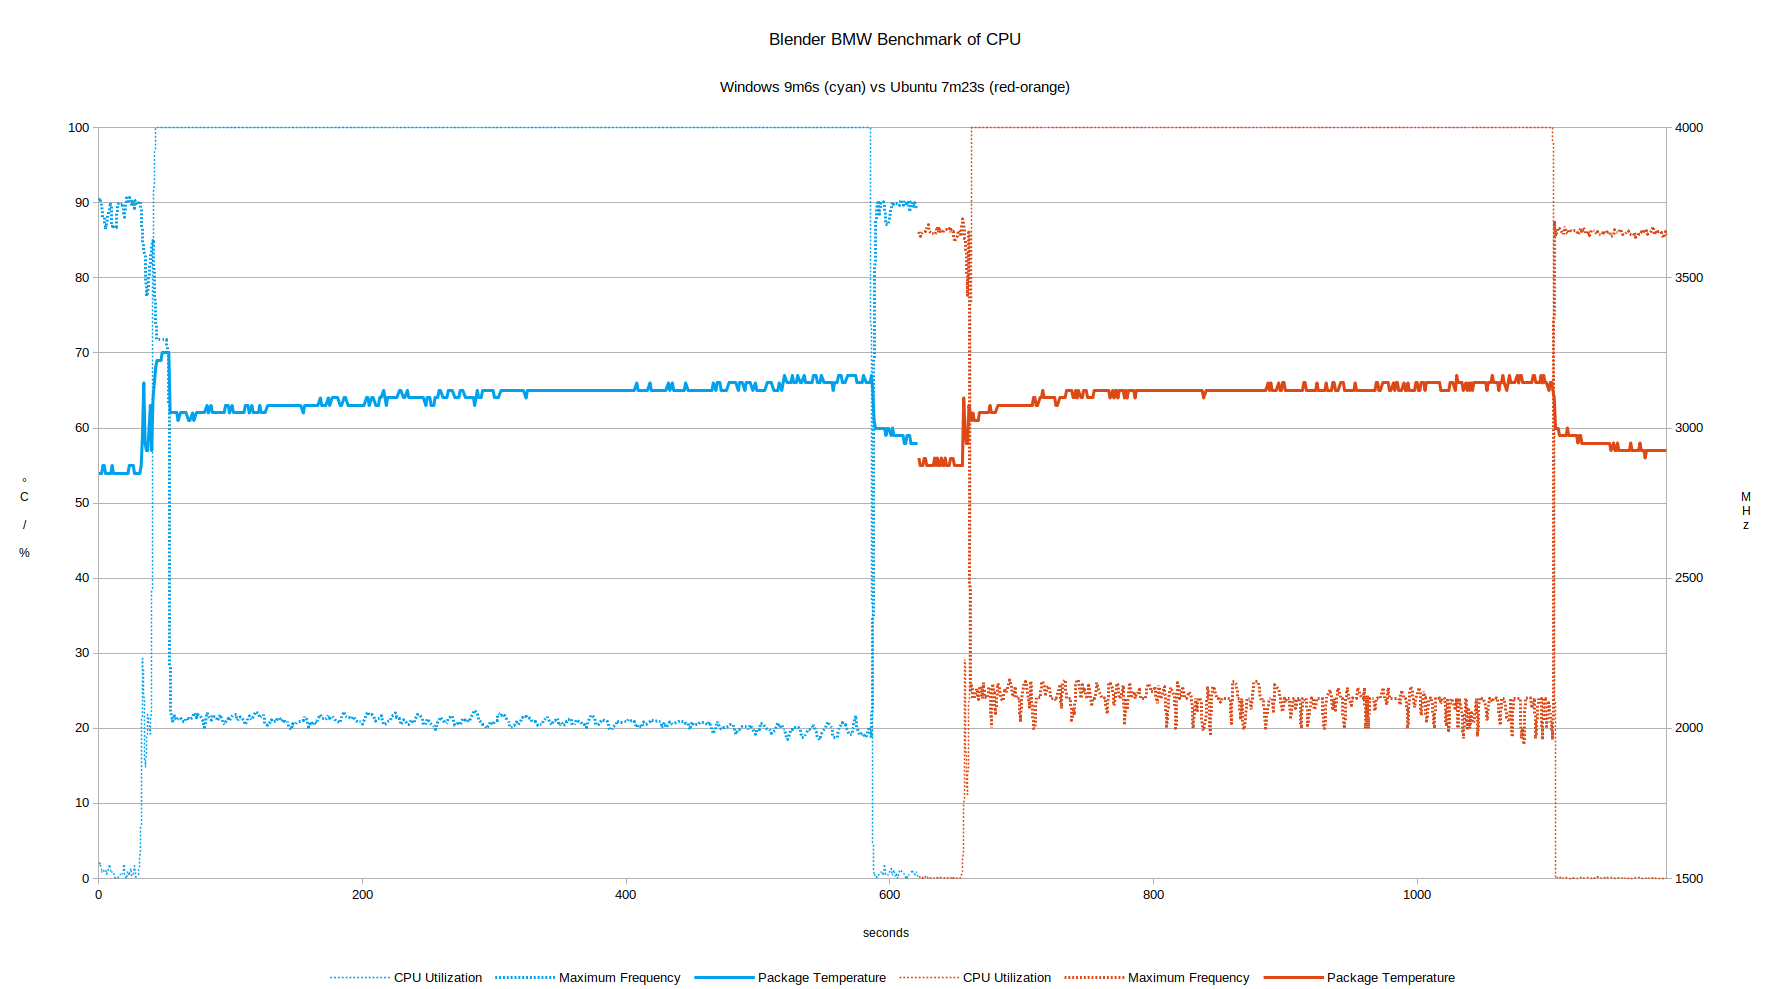
The CPU throttling observed in Windows also occurs in Ubuntu. This can be seen clearly when repeating the Blender ‘BMW’ benchmark for CPU whilst monitoring CPU utilization, maximum frequency, and package temperature:
4K Video Playback
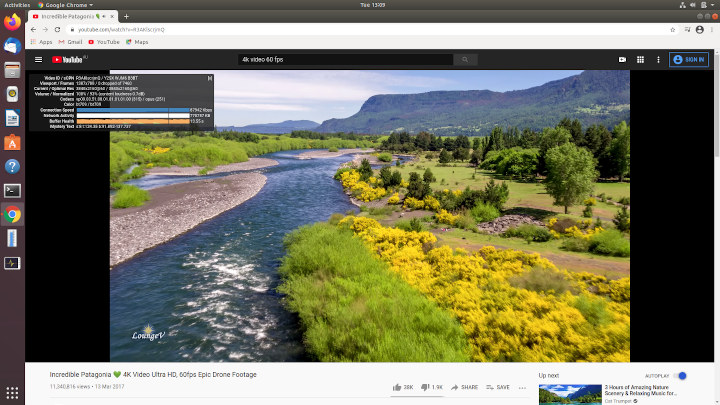
I tested 4K video playback in Edge, Chrome and Kodi on Windows and in Firefox, Chrome and Kodi on Ubuntu. 4K at 30 FPS presented no problem however 4K at 60 FPS when played in browsers on Windows resulted in the occasional dropped frame:
whereas this wasn’t an issue on Ubuntu:
Although hardware acceleration is not supported on Ubuntu for NVIDIA graphics when decoding VP9 and 10-bit HEVC (H.265) videos resulting in software decoding being used the playback was still flawless:
Thermals
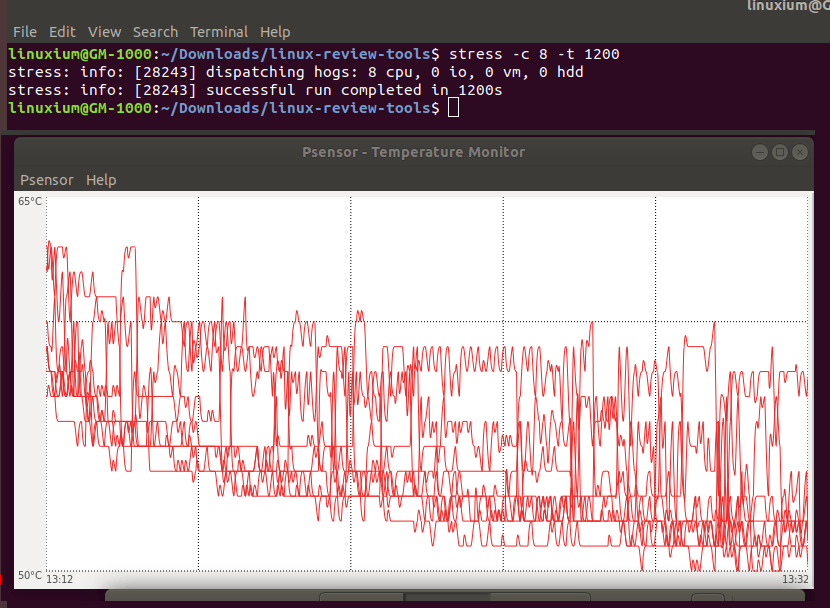
During benchmarking the room temperature was around 24°C and the CPU temperatures peaked at 69°C when running Blender on Windows. This resulted in the temperature of the surface of the exterior heat sink measuring 59°C making it too hot to touch, and it’s actually normal for a fanless metal enclosure, as the heat should dissipate through the enclosure instead of being trapped inside. As the device was passively cooled it takes time for both the CPU and the heat sink to cool down.
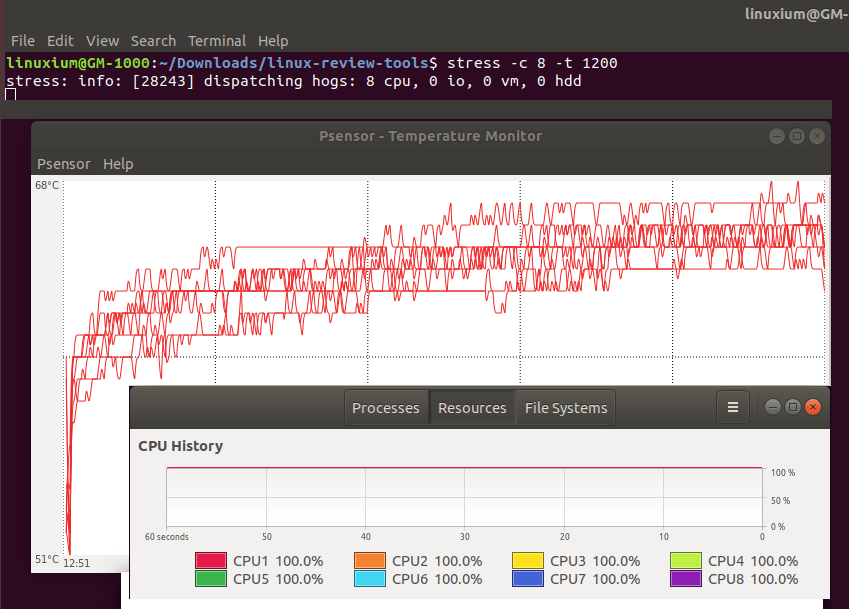
To illustrate this I ran ‘stress’ in Ubuntu which shows the CPUs immediately reaching 60°C and then climb to a maximum average of 66°C whilst the room temperature was 23°C:
The temperature of the surface of the heat sink taken immediately after the test was 57°C. Twenty minutes later the CPUs had dropped to an average of 52°C (with one CPU at 58°C) and the heat sink had dropped to 50°C:
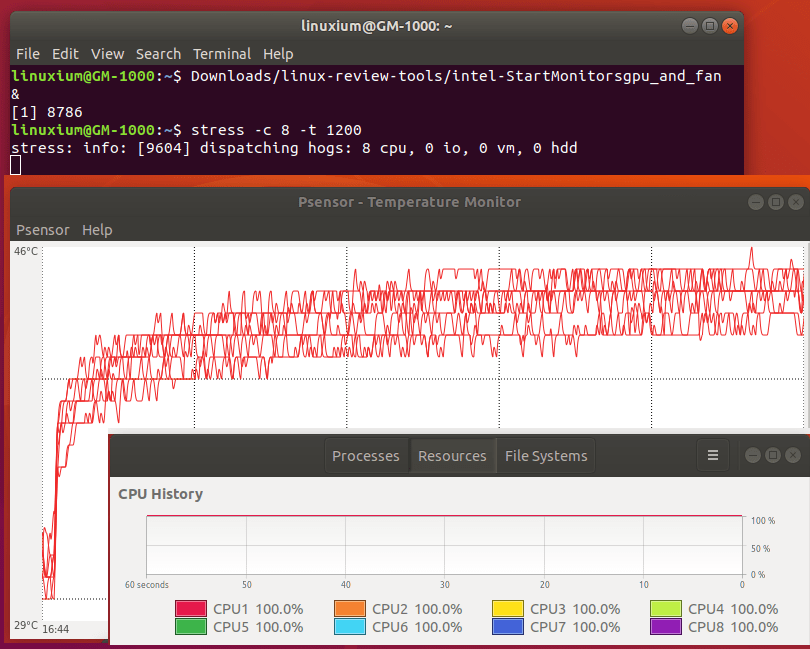
Installing the optional external fan kit resulted in the fans constantly running and consequently quite noisy at 50 dBA although effective as the new baseline average temperature for the CPUs became 32°C.
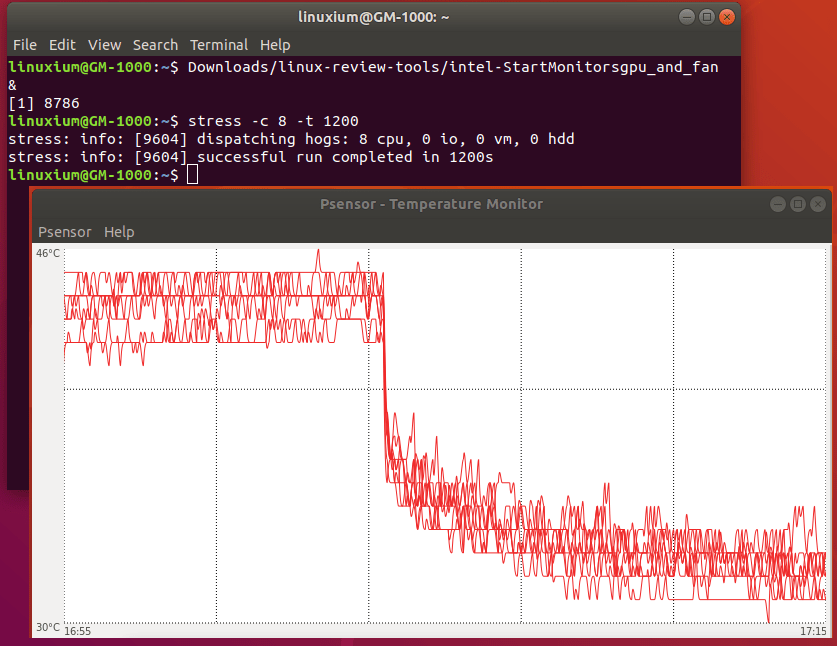
Running the ‘stress’ test again saw the CPUs temperature immediately reach 40°C and then climb to an average of 44°C:
After the test finished the CPUs dropped quickly to 37°C before returning back to 32°C:
The temperature of the heat sink was not measured due to be covered by the fan assembly.
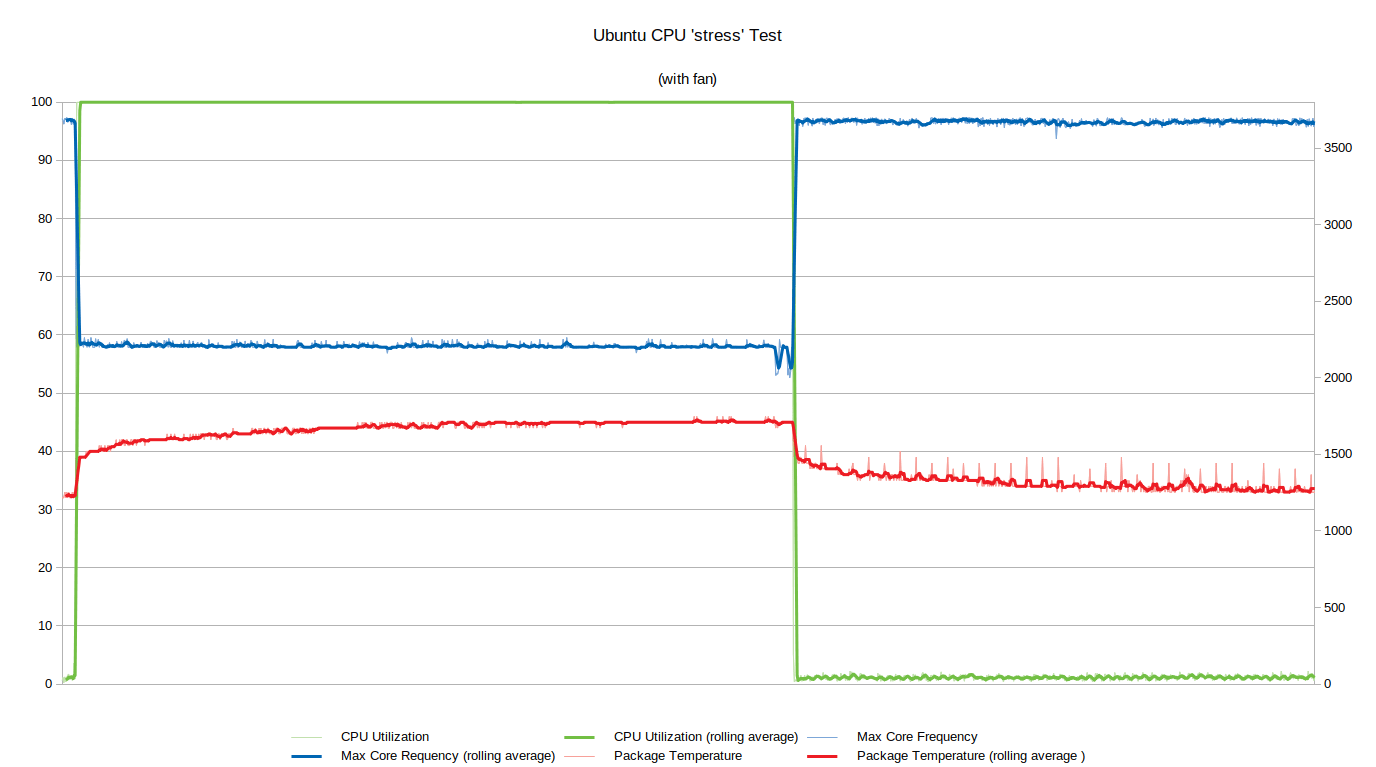
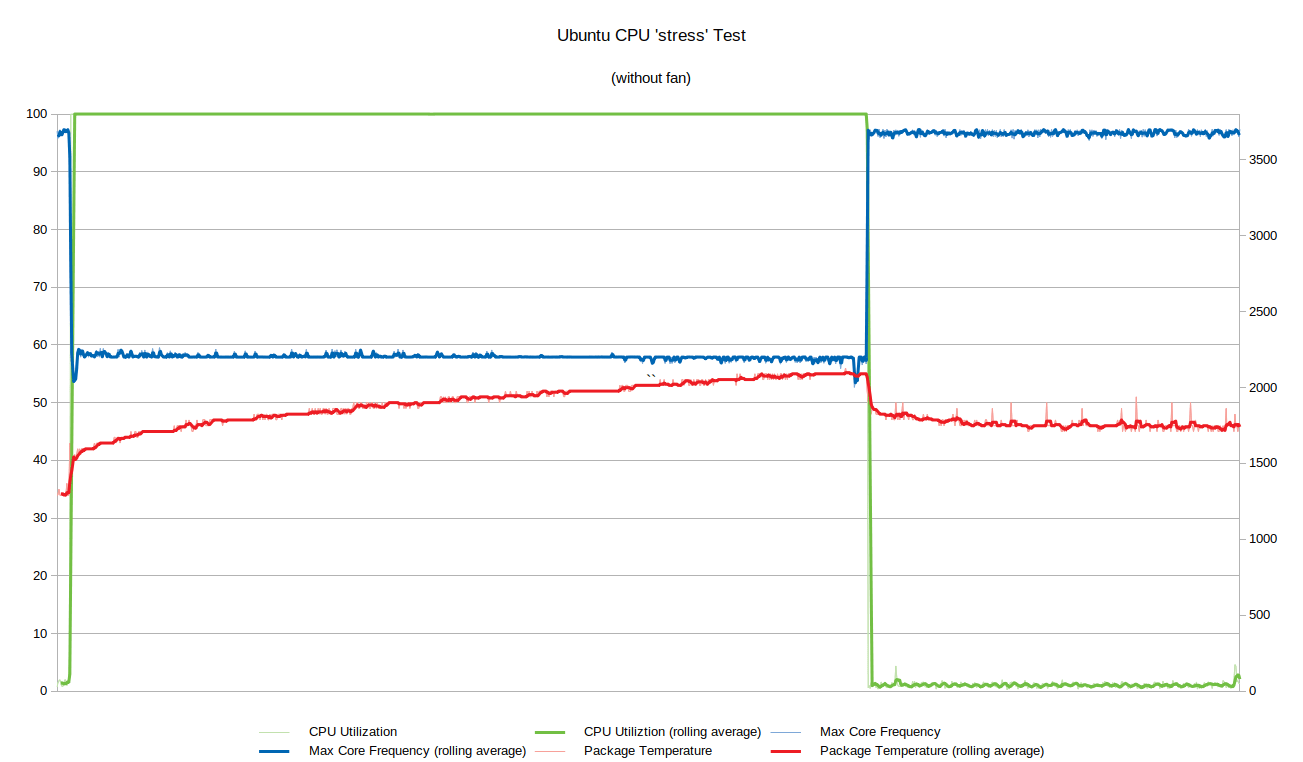
The ‘stress’ test was run whilst monitoring CPU utilization, maximum frequency and package temperature first with the external fan:
and then repeated without the fan:
again showing that the CPU throttling is related to power and not temperature.
Windows vs Ubuntu on Cincoze GM-1000
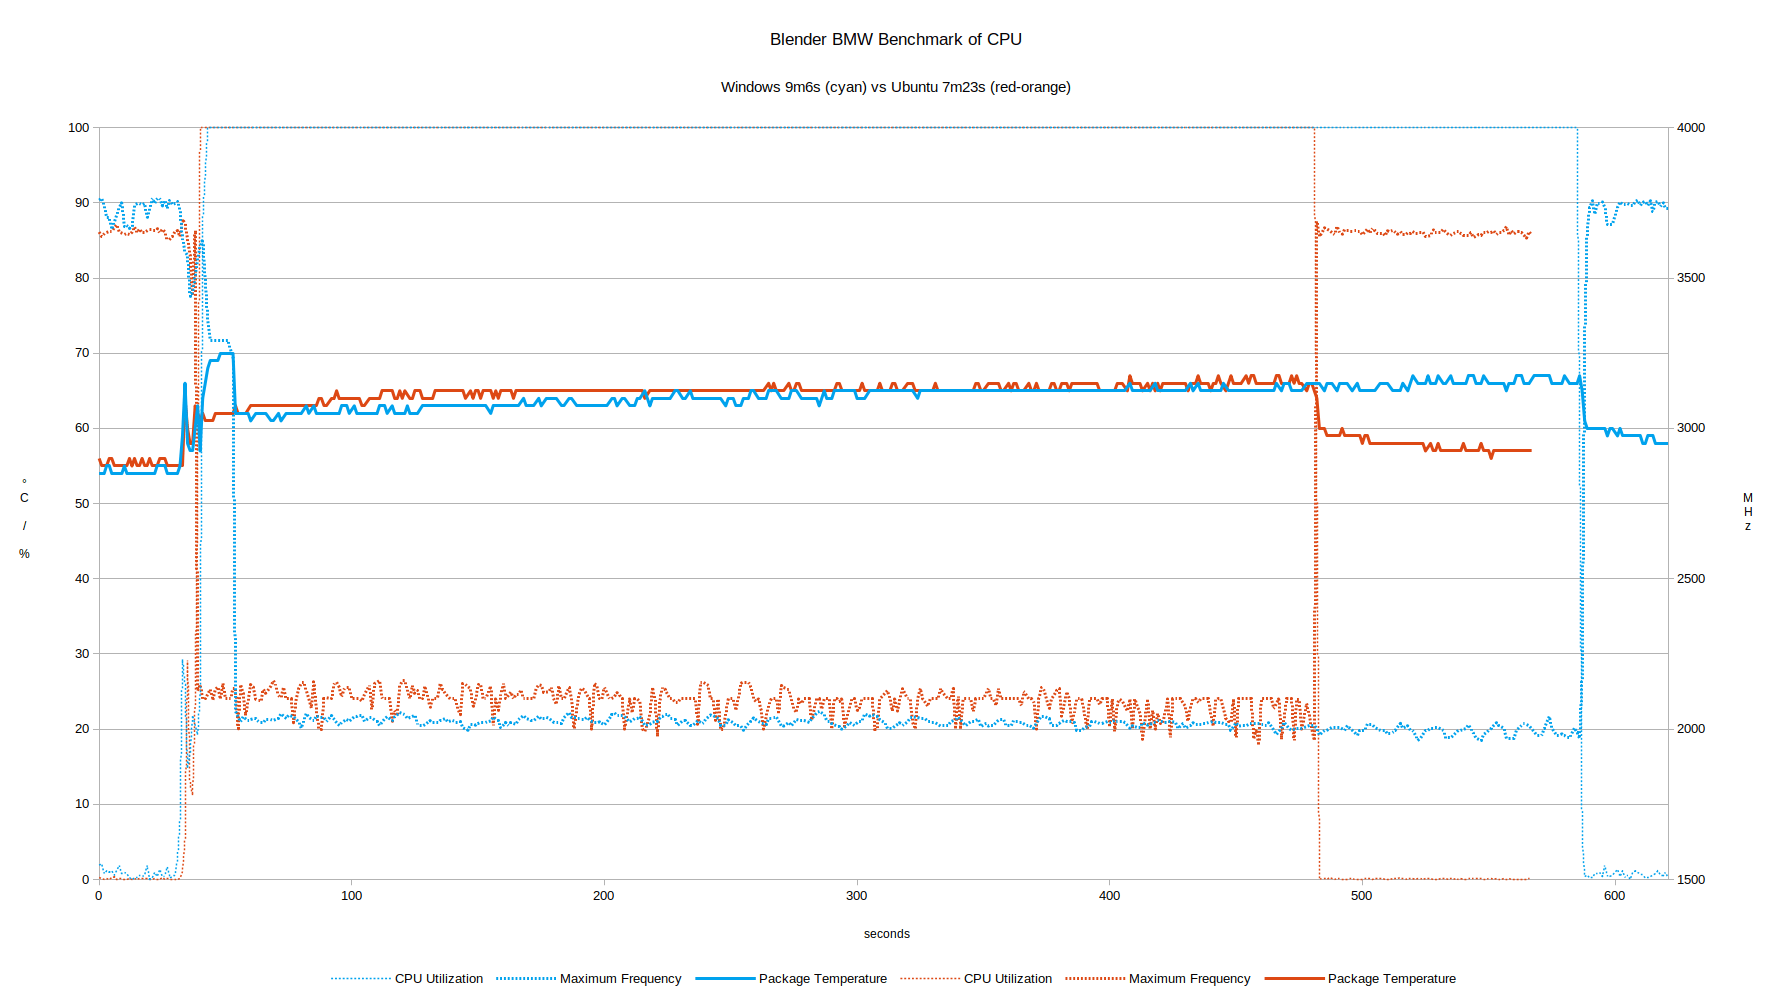
Whilst a detailed comparison between the two operating systems is beyond the scope of this review, it is worth noting some of the key findings I observed. First looking at the performance tools common between the two systems. Overall Ubuntu performs slightly better in the majority of the benchmarks than Windows and this can be visually shown by comparing the same Blender benchmark in each OS:
Interestingly the idle CPU frequency is higher in Windows than in Ubuntu however this is reversed when the CPUs are put under load.
Networking
Network connectivity throughput was measured for the rear 1GB Ethernet port on Ubuntu using ‘iperf’. Upload was measured at 934 Mbits/sec and download at 908 Mbits/sec.
Power Consumption
Power consumption without the eternal fans installed was measured as follows:
- Powered off (shutdown) – 3.4W (Windows) and 3.5W (Ubuntu)
- BIOS* – 44.8W
- GRUB boot menu – 46.1W
- Idle – 27.9W (Windows) and 27.5W (Ubuntu)
- CPU – 103.2W then 53.4W (Windows ‘cinebench’) and 71.6W then 56.4W (Ubuntu ‘stress’)
- 4K 60 FPS videos** – 58.7W (Windows Edge) and 62.2/74.3W (Ubuntu Firefox/Chrome)
*BIOS (see below)
**The power figures fluctuate so the value is the average of the median high and median low power readings. The 4K 60 FPS video power draw in Ubuntu Chrome was higher than other browsers.
BIOS
The BIOS is quite unrestricted and covered in detail in the user manual.
Final Observations
Whilst the GM-1000 embedded GPU computer’s passive performance is good the key highlights of the device are the configurability, the expansion capabilities, and the high-quality documentation. You can check US pricing and options on OnLogic website.

Ian is interested in mini PCs and helps with reviews of mini PCs running Windows, Ubuntu and other Linux operating systems. You can follow him on Facebook or Twitter.
Support CNX Software! Donate via cryptocurrencies, become a Patron on Patreon, or purchase goods on Amazon or Aliexpress


