
I’ve recently upgraded my machine from Ubuntu 14.04.4 to Ubuntu 16.04.1, but while my computer used to boot in about 40 seconds, after the upgrade boot times increased considerably to 2 to 3 minutes.
 The first easy check was to look at dmesg:
|
1 2 3 4 5 |
[ 9.776990] usb 3-4.4.2: pl2303 converter now attached to ttyUSB0 [ 11.510201] floppy0: no floppy controllers found [ 98.444400] vboxdrv: Found 8 processor cores [ 98.460319] vboxdrv: TSC mode is Invariant, tentative frequency 4026996449 Hz [ 98.460321] vboxdrv: Successfully loaded version 5.0.26 (interface 0x00240000 |
There’s a bit 87 seconds gap between checking for the floppy, and VirtualBox drivers loading. So there’s definitely an issue here, but the log does not exactly give a clear queue.
I’ve read you could use systemd-analyze to find which process(es) may be slowing down your computer at boot time:
|
1 2 3 4 5 6 7 8 |
systemd-analyze blame 8.121s apt-daily.service 7.658s NetworkManager-wait-online.service 931ms docker.service 710ms winbind.service 695ms nmbd.service 647ms samba-ad-dc.service 543ms ModemManager.service |
Two processes are taking close to 8 seconds, but those 16 seconds still do not explain why it takes 2 minutes more to boot…Eventually, I realized systemd-analyze has a few more tricks up its sleeves:
|
1 2 3 4 |
systemd-analyze Startup finished in 5.784s (kernel) + 3min 651ms (userspace) = 3min 6.425s systemd-analyze plot > test.svg |
The first command shows there’s no problem with the kernel itself, and something is slow in user space. The second command draws a huge boot chart (SVG), whose shape looks like the picture below.
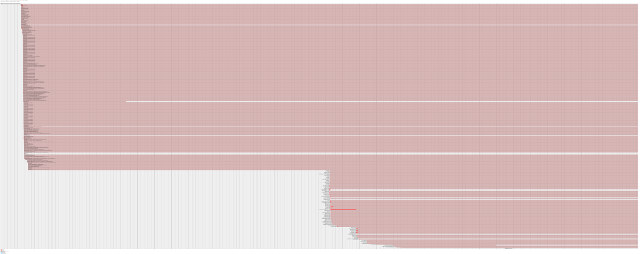 So we have something to look at, namely the area just before the large gap… I’ve zoomed in on it:
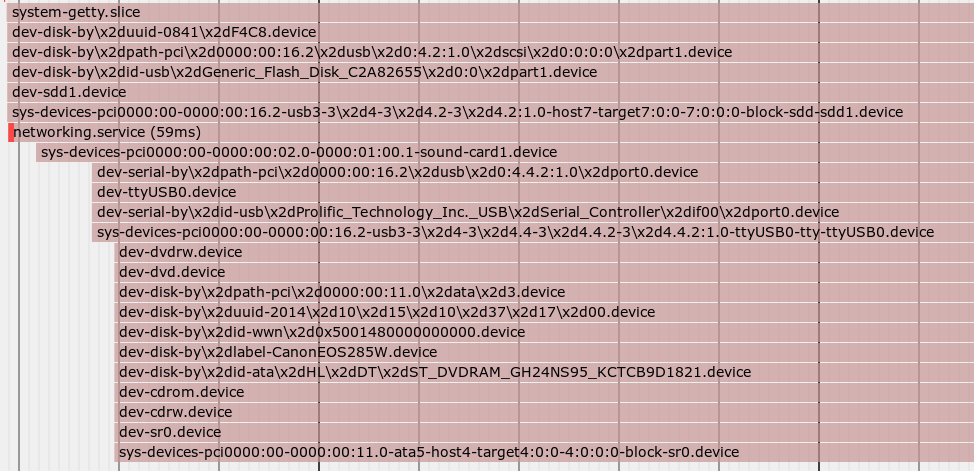 There are a few things there including the DVDROM drive, and “Prolific Technology Serial Controller” connected to /dev/ttyUSB0. The latter is a USB to TTL debug board based on PL2303, so I removed it and rebooted my machine, and miracle! Boot time was reduced to just 17 seconds:
|
1 2 3 4 |
systemd-analyze Startup finished in 5.764s (kernel) + 11.282s (userspace) = 17.047s systemd-analyze plot > test2.svg |
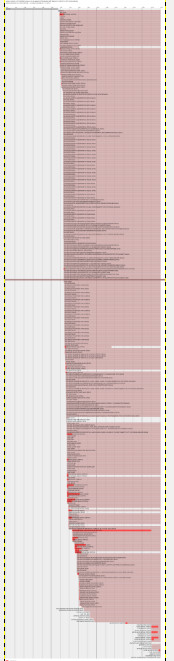 The SVG chart shape, shown on the right, also changed completely as it booted most of the same services in much less time. So since I don’t use the debug board everyday, I’ll make sure I only connect it when needed. Ideally, I suppose a bug should be filled, but I’m not sure which package cause the issue.
On a rather unrelated note, yesterday I also decided to look into Firefox performance issues (switching or closing tabs would take 2 to 3 seconds), and I discovered recent versions of Firefox browser (47+ and greater) include support for “about:performance” tab showing which add-on(s), plugin(s), or page(s) may be problematic. Just let it run for a while, and go about your business browsing the web, and then come back to the tab to check if any has many alerts. It helped me find an add-on slowing down browsing considerably, so I disabled it, and performance is now much better.

Jean-Luc started CNX Software in 2010 as a part-time endeavor, before quitting his job as a software engineering manager, and starting to write daily news, and reviews full time later in 2011.
Support CNX Software! Donate via cryptocurrencies, become a Patron on Patreon, or purchase goods on Amazon or Aliexpress