It can be pretty useful to monitor the CPU load, memory and storage usage, and network traffic of your boards, and they are already graphical tools like System Monitor on Ubuntu providing most of the information, and monit can be used on server, but I’ve recently been introduced to RPi-Monitor utility for Raspberry Pi and Orange Pi boards (patched version), that very easy to install, and provide neat chart of many different variables.
Since I’m currently playing with Orange Pi One board running armbian, so that’s the platform I’ve used to run RPi-Monitor (OPi-Monitor). The usage should be exactly the same on Raspberry Pi, but the installation steps are little different.
To install RPi-Monitor on Orange Pi One, open a terminal or access the serial console, and you can install and start the service with a single command line:
|
1 2 3 4 5 6 7 8 |
sudo armbianmonitor -r Installing RPi-Monitor. This can take up to 5 minutes. Be patient please .... Now patching RPi-Monitor to deal correctly with H3 Now you're able to enjoy RPi-Monitor at http://192.168.0.112:8888 |
It actually took around 8 minutes on my board, as it downloaded and installed required packages. Once the installation is complete redirect your computer browser to the URL provided at the end of the script to access the web interface.
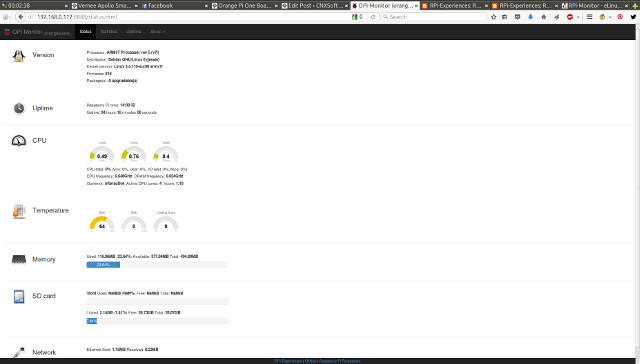
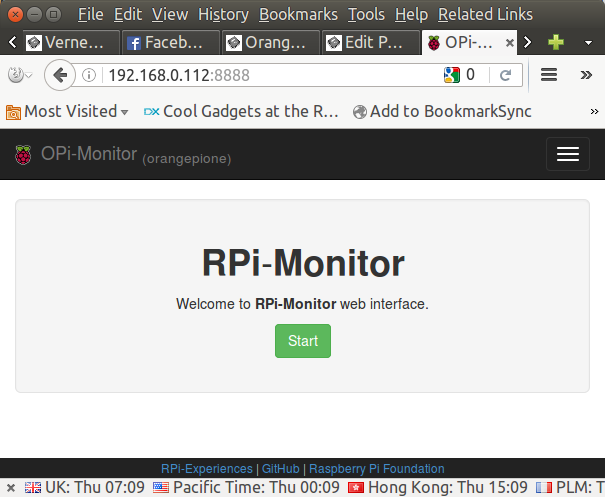 Click on Start to make the system automatically collect data, and you’ll end up on the status page with version information, uptime, CPU usage, temperature, memory usage, SD card usage, and network traffic.
That’s all good, but my favorite part is the Statistics tab with show really neat and useful charts.
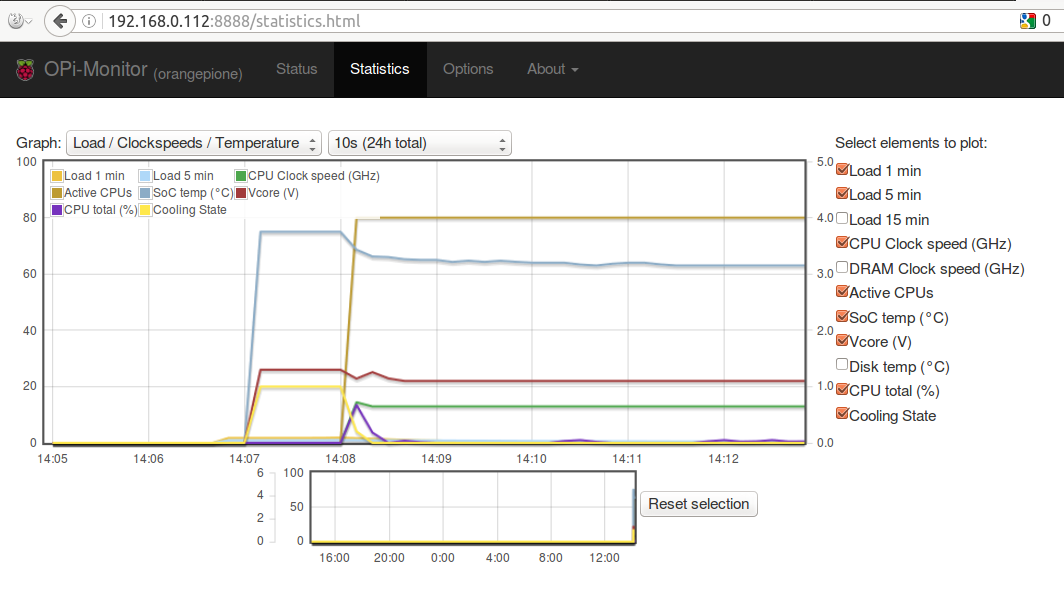
They may be confusing at first since two scales are used for multiple elements, with for example the left sacle (0 to 100) showing CPU usage in percent and SoC temperature, with the left scale (0 to 5) used for the other metrics such as CPU frequency in GHz, Active CPUs, etc… Each element can be easily disabled and enabled.
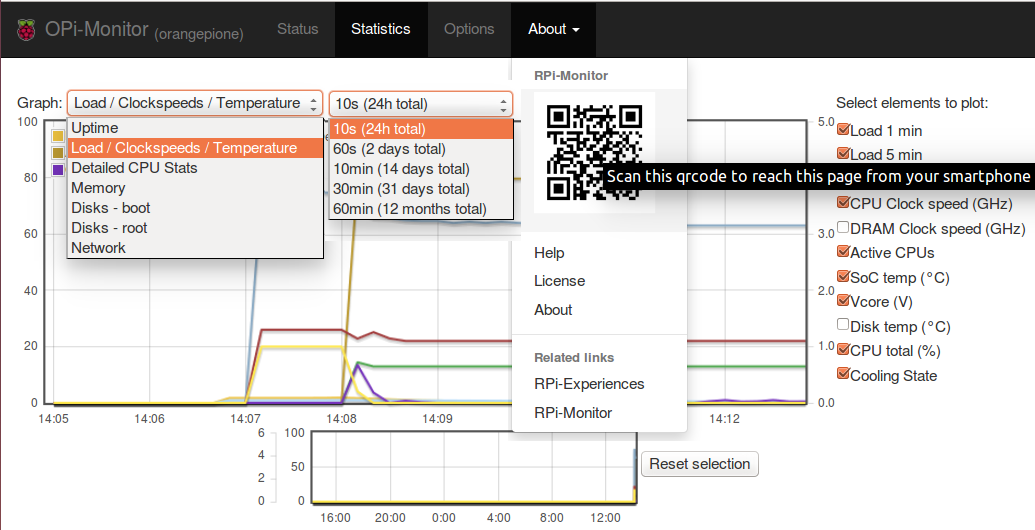
There are 7 types of charts: Uptime, Load / Clock speeds / Temperature, Details CPU Stats, Memory. Disks – boot, Disks – root, and Network, and 6 update options with the fastest being updated every 10 seconds for a 24 hour window, and the slowest every 60 minutes for a one year view of the board. The Options tab is only used to select the default update time, and you can also access the charts in your smartphone’s browser by scanning the QR core in the About section.
I’ve run sysbench to show the chart in action, and at first I was confused simply because the charts are not updated in real-time, and you need to reload the page to get the latest available data. There are two windows in the Statistics tab with the large one allowing you to zoom-in a specific time period out of the 24-hour window using your mouse, and the smaller one always shows the 24-hour charts (or whatever update time you have selected). The Reset selection clear the zoom in the larger chart.
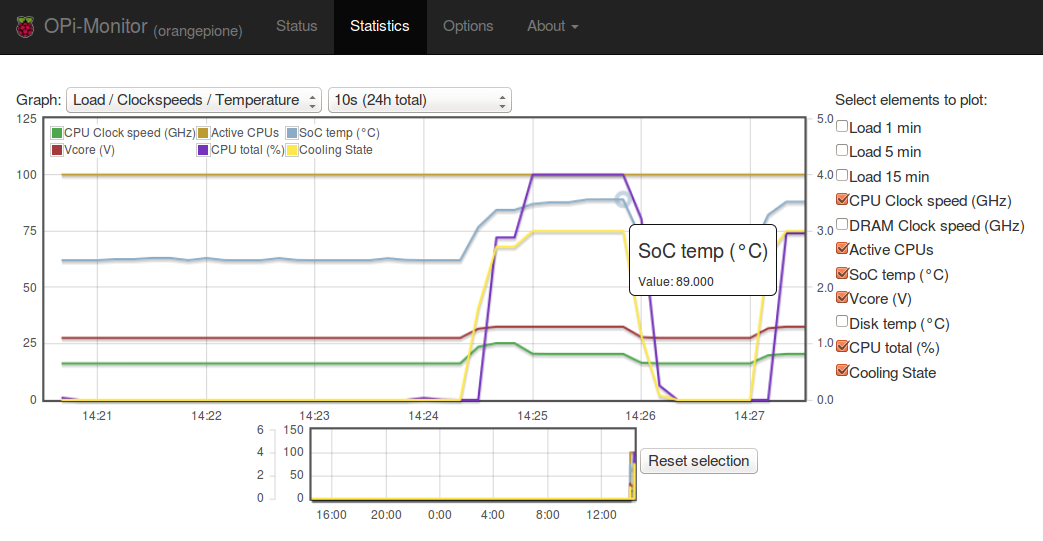
I’ve run sysbench twice on the chart above, checking the value as the second test was running. What we can see is that as CPU usage climbed to 100%, the CPU temperature raised to 89.0C, which triggered various cooling states of the processor, leading to drops in the CPU frequency as the test was running. That means for this type of load the board would likely benefit from a heatsink and/or fan to operate at a higher performance level.
RPi-monitor is open source and you can get the source code and/or report issues on Raspberry Pi boards in github. You can get more info and updates on the developer’s blog.

Jean-Luc started CNX Software in 2010 as a part-time endeavor, before quitting his job as a software engineering manager, and starting to write daily news, and reviews full time later in 2011.
Support CNX Software! Donate via cryptocurrencies, become a Patron on Patreon, or purchase goods on Amazon or Aliexpress
