I’ve already measured power consumption running Antutu and playing a 4K video on Rockchip RK3288 and Amlogic S812 platform, as described in “Power Consumption of Amlogic S812 and Rockchip RK3288 TV Boxes“, and now that I have an Intel Bay Trail-T mini PC running Android 4.4 with Wintel W8, I was interested in comparing its power consumption to the ARM platform.
[Update: I forgot to mention measurements have all been done @ ~5V.]
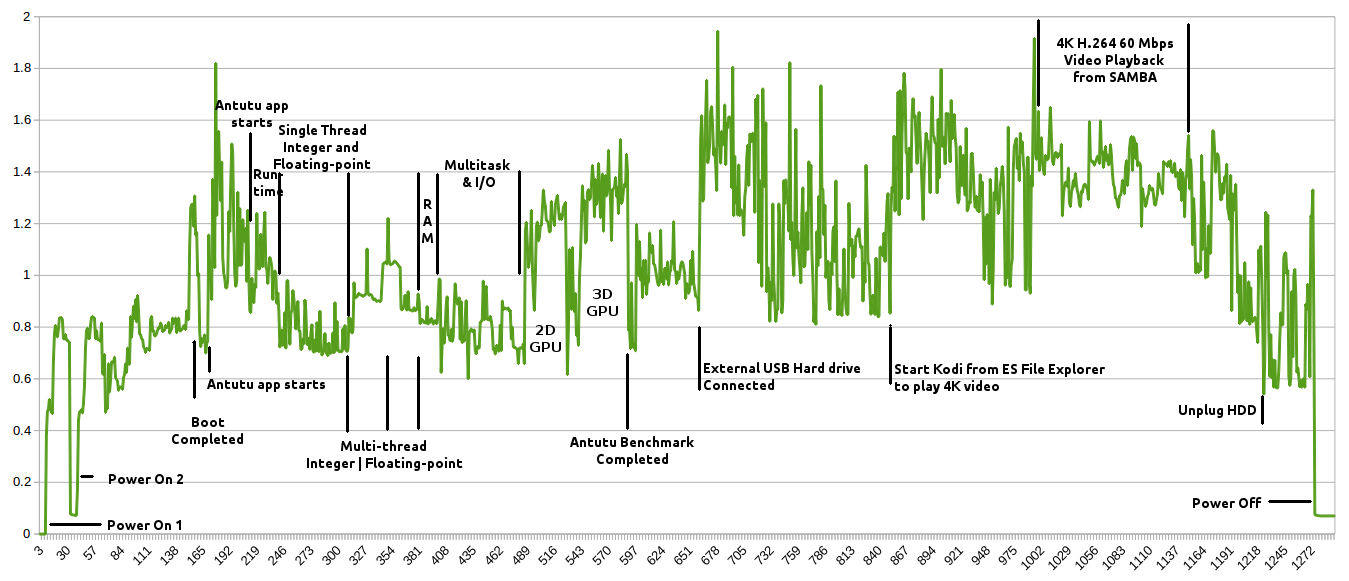
Vertical Axis: Amperes; Horizontal Axis: Sample number (every 0.5 second)
The test normally consists in several steps:
- Boot the device
- Run the latest Antutu benchmark
- Connect a USB hard drive
- Play a 4K video in Kodi from the hard drive
- Diconnect the hard drive
- Power off the device
But since the current draw was a little to high at times, I got a few issues with my setup. First, I had to boot twice hence the “Power On 1” and “Power On 2” strings on the chart, then Antutu 3D graphics benchmark did not fully complete, but we still got enough data to evaluate power consumption, and for some reasons the video would not play from the USB hard drive, so I played the video from SAMBA instead. We can see that the peak amperage is about 2A (~10 Watts), and power off current is less than 0.1A. But let’s include the chart for the ARM platform for comparison sake.
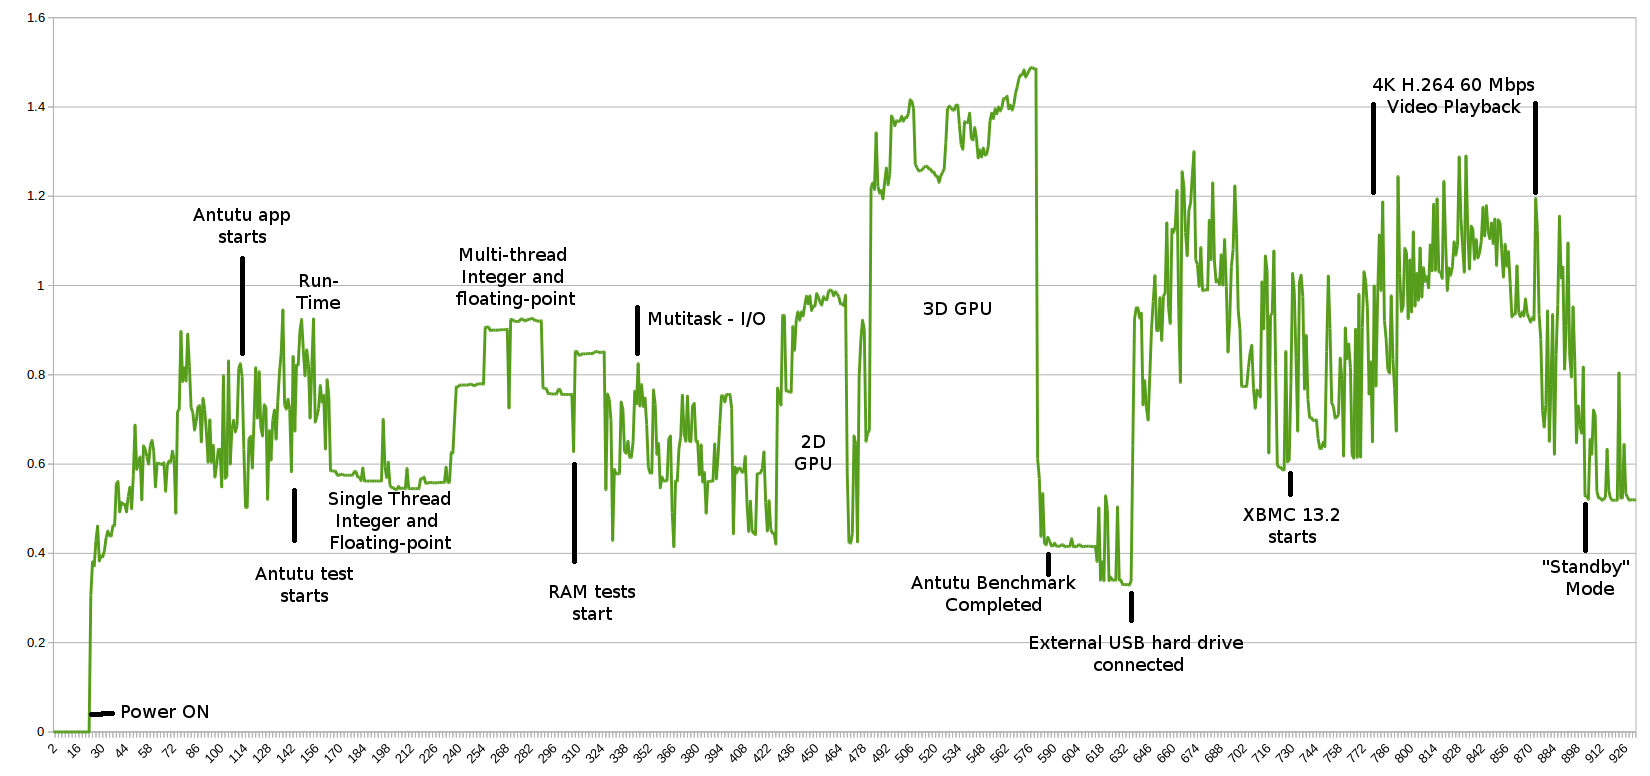
Vertical Axis: Amperes; Horizontal Axis: Sample number (every 0.5 second)
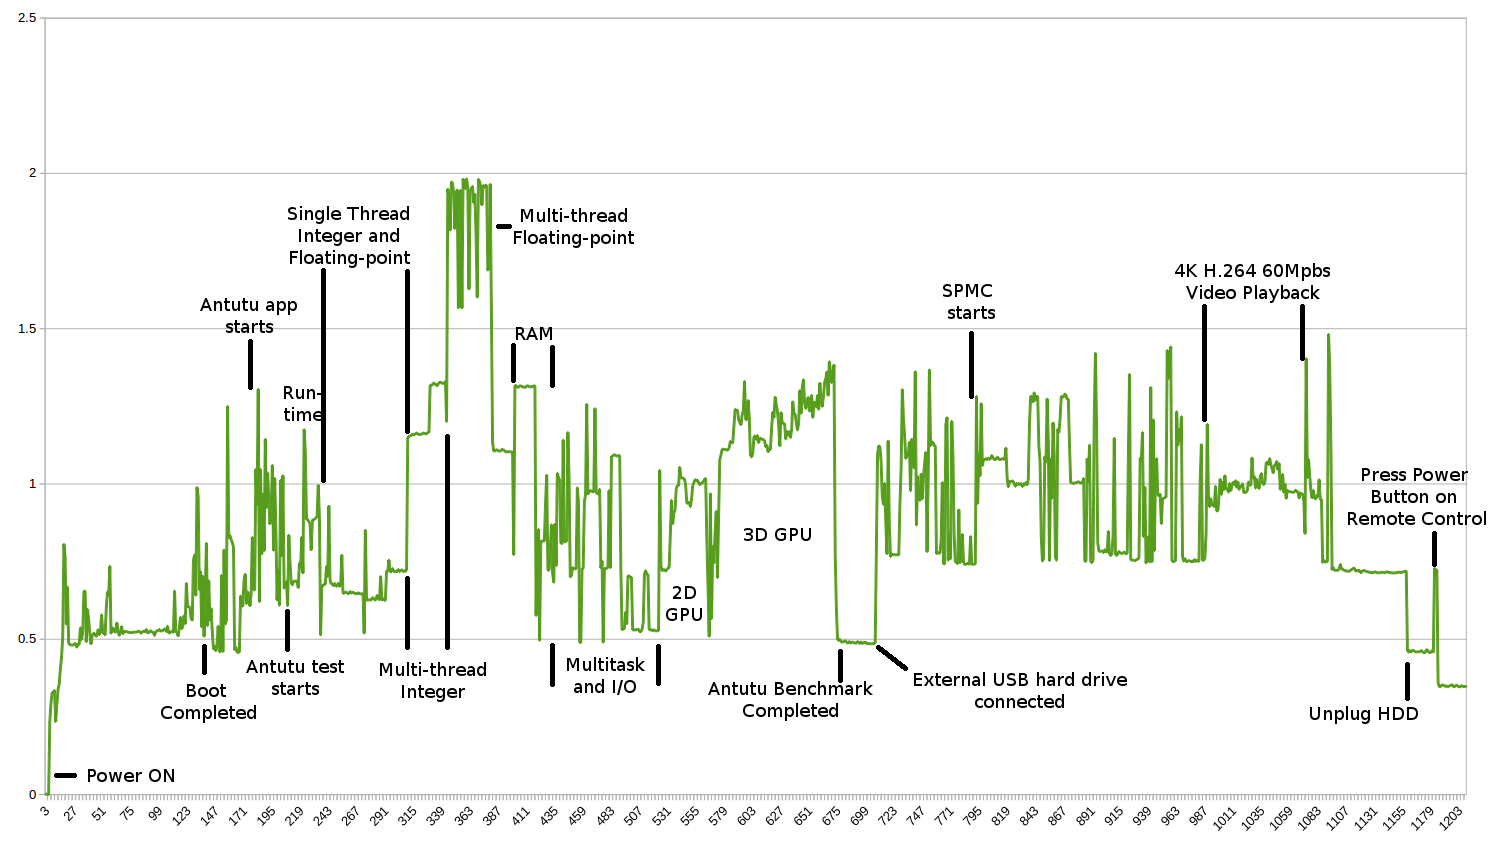
Vertical Axis: Amperes; Horizontal Axis: Sample number (every 0.5 second)
While Amlogic S812 averages around 800 mA, and Rockchip RK3288 is closer to 900 mA on aggregate, the Intel platform draws a bit more current at 1.05A on average. It’s only during 3D graphics tests than ARM and Intel platform are evenly matched. Idle power is also better for ARM Amlogic S812 idling at 400 mA, RK3288 at 500 mA, and Atom Z3735F at 600 mA. However, Wintel W8 design appears to be better than Open Hour Chameleon and Eny M8S when it comes to standby / power off power consumption, and for some reasons RK3288 consumes a lot of power during multi-threaded floating-point operations.
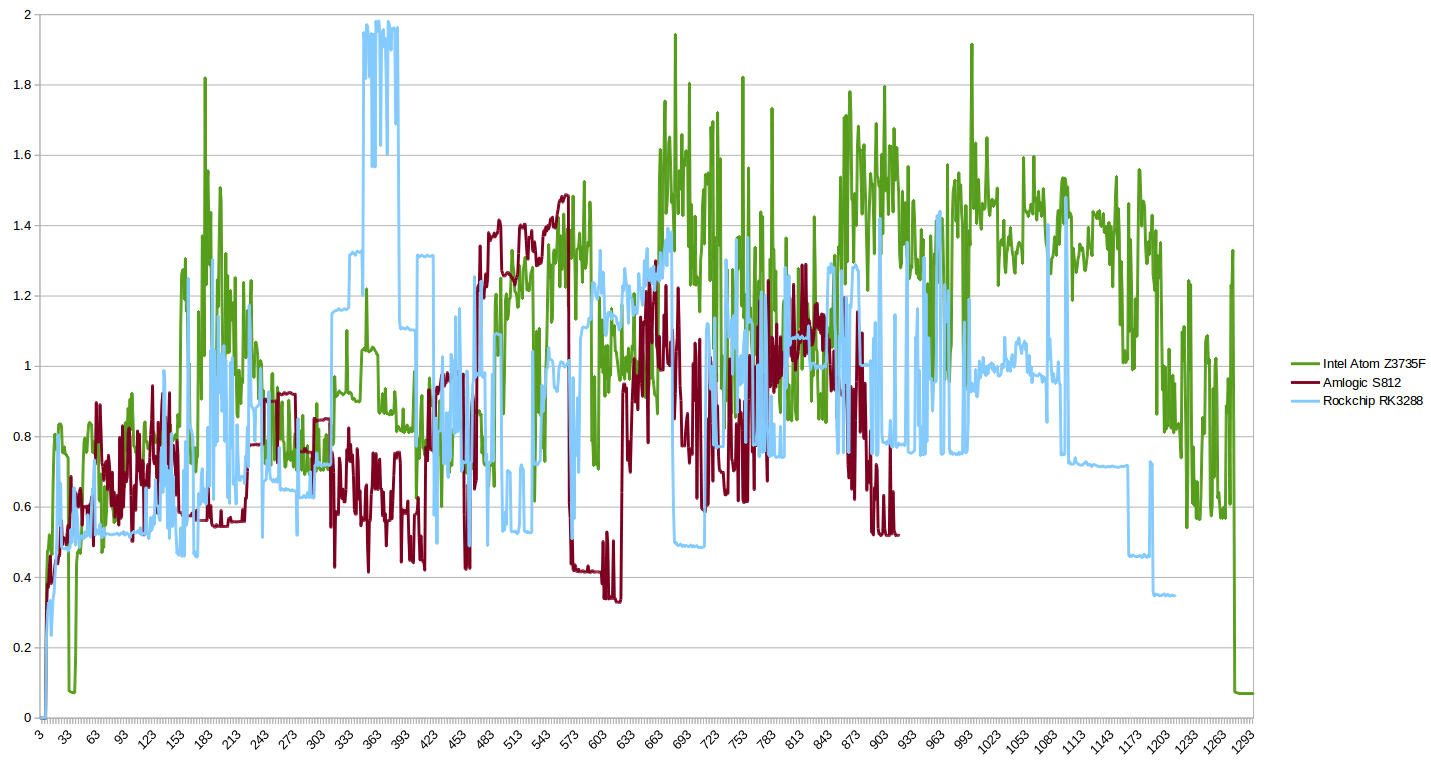
The tests for the three platform have not completed in the same amount of time, but I’ve still superposed all three charts into one, and we can clearly see the multi-core floating-point anomaly for RK3288, and that the Intel platform appears to consume more power than others once the hard drive is connected.

Jean-Luc started CNX Software in 2010 as a part-time endeavor, before quitting his job as a software engineering manager, and starting to write daily news, and reviews full time later in 2011.
Support CNX Software! Donate via cryptocurrencies, become a Patron on Patreon, or purchase goods on Amazon or Aliexpress