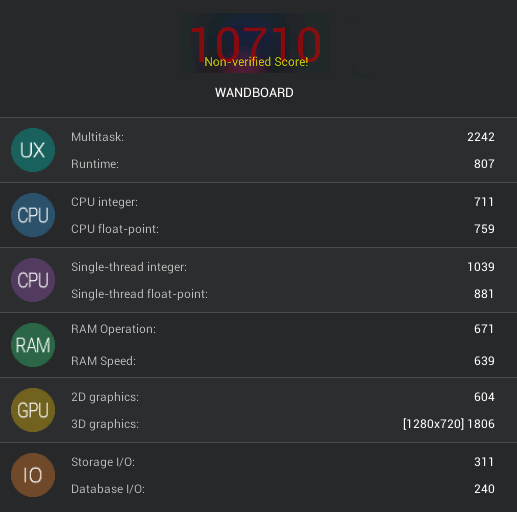
Most of the time people compare the performance of different hardware platforms, but since Wandboard released an Android 5.0 image in the last few days, I wondered what difference two years of software development may make by comparing benchmark results. So I ran both Antutu 5.6.1 and Vellamo 3.1 on Android 4.1.2 Jelly Bean (android-4.1.2-wand-dual-20130411.zip) and the latest Android 5.0 Lollipop firmware for Wandboard Dual (Freescale i.MX6 Dual) development board.
Android 4.1.2 Benchmark Results
Antutu 5.6.1
 Vellamo 3.1
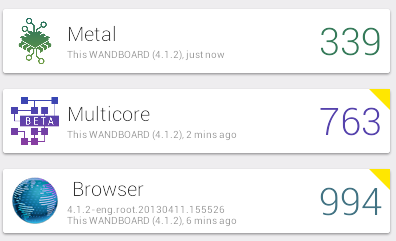 You’ll notice the yellow triangle on the top right corner of the multicore and browser results due to some warning related to missing CPU frequency information, and a DOM timeout.
Android 5.0 Benchmark Results
Antutu 5.6.1
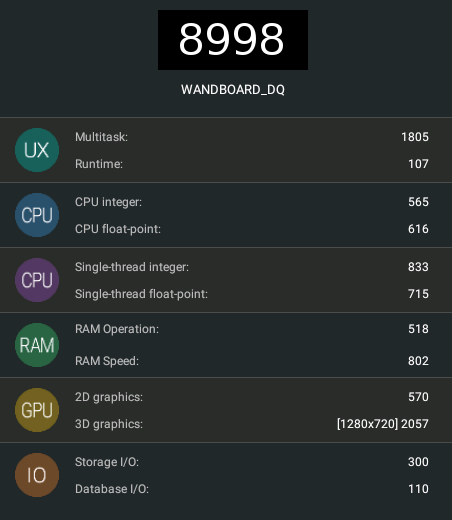 The 2D graphics looked weird at some point as it zoomed out on1/4 of the display. The screenshot did not show the total score, so I added it manually to the picture above.
Vellamo 3.1
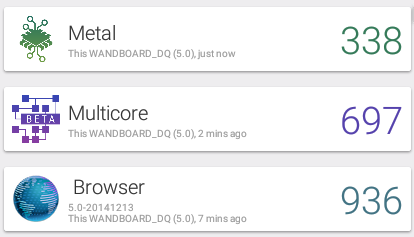 Vellamo did not report any anomalies during testing.
Comparison Table
The overall scores are disappointing, and I was really expecting to show how much faster Lollipop is compared to Jelly Bean, but maybe further performance improvements will come as Wandboard’s Lollipop image is a beta release. The detailed scores show some striking differences. In my previous comparison I used delta in percentage, but that confused some people, so instead I’ve used the ratio between Lollipop and Jelly Bean, meaning a ratio of 1 has the same performance, a Lollipop is faster with a ratio greater than 1, and Jelly Bean is faster with a ratio smaller than 1.
| Android 4.1.2 Linux 3.0.35 |
Android 5.0 Linux 3.10.53 |
Ratio | |
| Antutu | 10,710 | 8,998 | 0.84 |
| Multitask | 2,242 | 1,805 | 0.81 |
| Runtime | 807 | 107 | 0.13 |
| CPU integer | 711 | 565 | 0.79 |
| CPU float-point | 759 | 616 | 0.81 |
| Single-thread integer | 1,039 | 833 | 0.80 |
| Single-thread float-point | 881 | 715 | 0.81 |
| RAM operations | 671 | 518 | 0.77 |
| RAM speed | 639 | 802 | 1.26 |
| 2D graphics | 604 | 570 | 0.94 |
| 3D graphics (1280×720) | 1,806 | 2,057 | 1.14 |
| Storage I/O | 311 | 300 | 0.96 |
| Database I/O | 240 | 110 | 0.46 |
| Vellamo Metal | 339 | 338 | 1.00 |
| Vellamo Browser | 994 | 936 | 0.94 |
| Vellamo Multicore | 763 | 697 | 0.91 |
Lollipop is only faster in the RAM speed and 3D graphics Antutu benchmarks, but slower for all other tests. The runtime test is much slower, maybe because of the switch between Dalvik and ART. I used the same micro SD card for the testing, yet database I/O is over 50% on Lollipop. I did get some error messages in the serial console with Lollipop when the system frees memory, but maybe that’s the normal process of Android killing background processes to reclaim memory:
|
1 2 3 4 |
lowmemorykiller: Killing 'tutu.ABenchMark' (2140), adj 647, to free 55324kB on behalf of 'kswapd0' (40) because cache 109784kB is below limit 112500kB for oom_score_adj 529 Free memory is -6284kB above reserved |
Other differences between Jelly Bean 4.1 and Lollipop include a unified image for Solo, Dual and Quad versions of the board since the board files have been replaced by device tree, and the SD card image is now 8GB, instead of 4GB.

Jean-Luc started CNX Software in 2010 as a part-time endeavor, before quitting his job as a software engineering manager, and starting to write daily news, and reviews full time later in 2011.
Support CNX Software! Donate via cryptocurrencies, become a Patron on Patreon, or purchase goods on Amazon or Aliexpress
